
Premature Mortality
Key Messages
- Quebec, Ontario, and B.C. are the top-ranked provinces with the lowest premature mortality rates in Canada, each scoring “A” grades when benchmarked with Canada’s international peers.
- Saskatchewan and Manitoba earn “D” grades but still rank higher than the worst-ranked peer country, the United States.
- Yukon has made big strides in the past 20 years on reducing premature mortality rates, but it still gets a “C” grade. The other two territories are at the bottom of the rankings—Nunavut’s premature mortality rate is roughly three times the national average.
Putting premature mortality in context
Premature mortality is a measure of unfulfilled life expectancy. Because deaths of younger people are often preventable, the premature mortality rate is a measure that gives more weight to the death of younger people than to older people.
The premature mortality rate is calculated by multiplying the number of deaths occurring at each age by the number of remaining years of life up to a selected age limit. The Organisation for Economic Co-operation and Development (OECD)—the source of the international data—makes an assumption that, on average, most people in Canada and the other OECD countries will live to the age of 70 (the selected age limit).1 If a person dies at 20, therefore, that person is considered to have lost 50 potential years of life. A person dying at age 60 has lost a potential 10 years of life. The premature mortality rate is then determined by adding up the potential lost years of individuals in each country.
By giving more weight to the death of younger people, the premature mortality indicator, along with the self-reported health status indicator, complements the life expectancy indicator, which has sometimes been criticized as placing too much importance on quantity of life and not enough on quality of life.
How do the provinces and territories rank relative to Canada’s international peers?
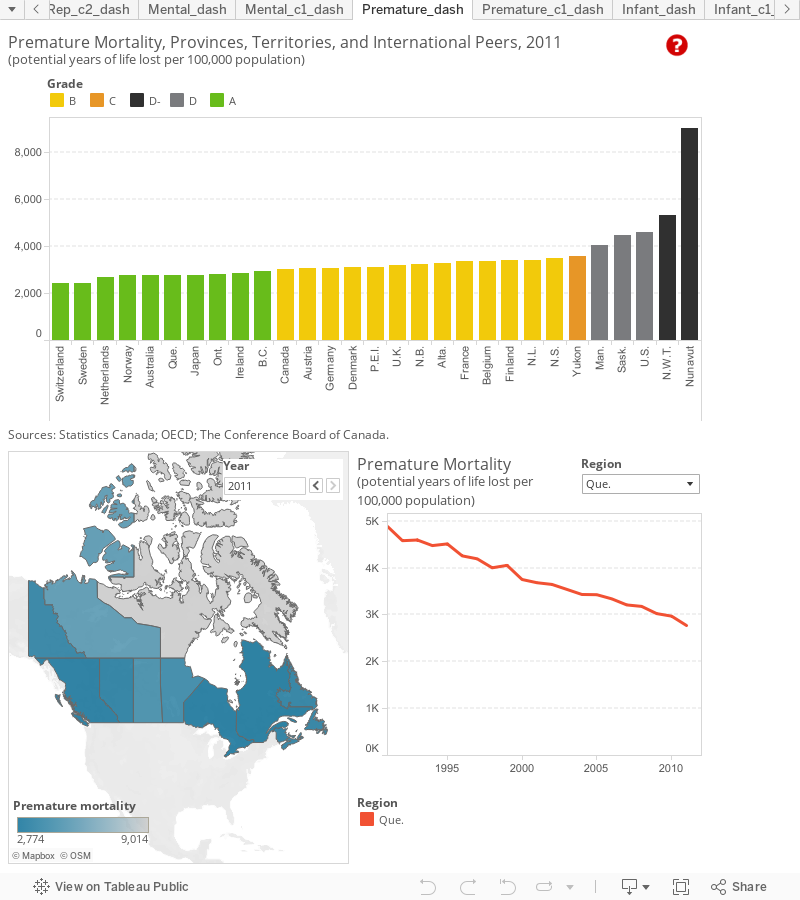
Quebec, Ontario, and B.C. score “A” grades on premature mortality, finishing in the top 10 among Canada’s international peers. These three provinces had premature mortality rates below the Canadian average of 3,007 years of potential lost life per 100,000 population in 2011. However, none of these provinces placed in the top 5, as Switzerland, Sweden, Netherlands, Norway, and Australia scored best on this indicator. Interestingly, 4 of the 5 countries that rank ahead of Canada on life expectancy also do better than Canada on premature mortality—Switzerland, Japan, Australia, and Sweden.
Although premature mortality rates in the Atlantic provinces and Alberta are higher than the Canadian average, these provinces still score “B” grades, because the lowest-ranked peer country, the Unites States, does much worse. As is the case with life expectancy, Manitoba and Saskatchewan are the worst-ranked provinces on premature mortality, with 4,042 and 4,464 potential years of life lost per 100,000 population, respectively, in 2011. Although both provinces score “D” grades, their premature mortality rates are still better than the U.S. average. The U.S. had a premature mortality rate of 4,569 years per 100,000 population in 2011—one-third of the premature mortality rate among males in the U.S. can be attributed to deaths resulting from external causes, including accidents, suicides, and homicides.2
Yukon ranks best among the territories, finishing with a “C” grade. The other two territories rank below the worst-performing country, the U.S., and so get “D-” grades. The premature mortality rate in Nunavut is about twice the rate in Saskatchewan, Canada’s lowest-ranking province.
How do the provinces and territories perform relative to each other?
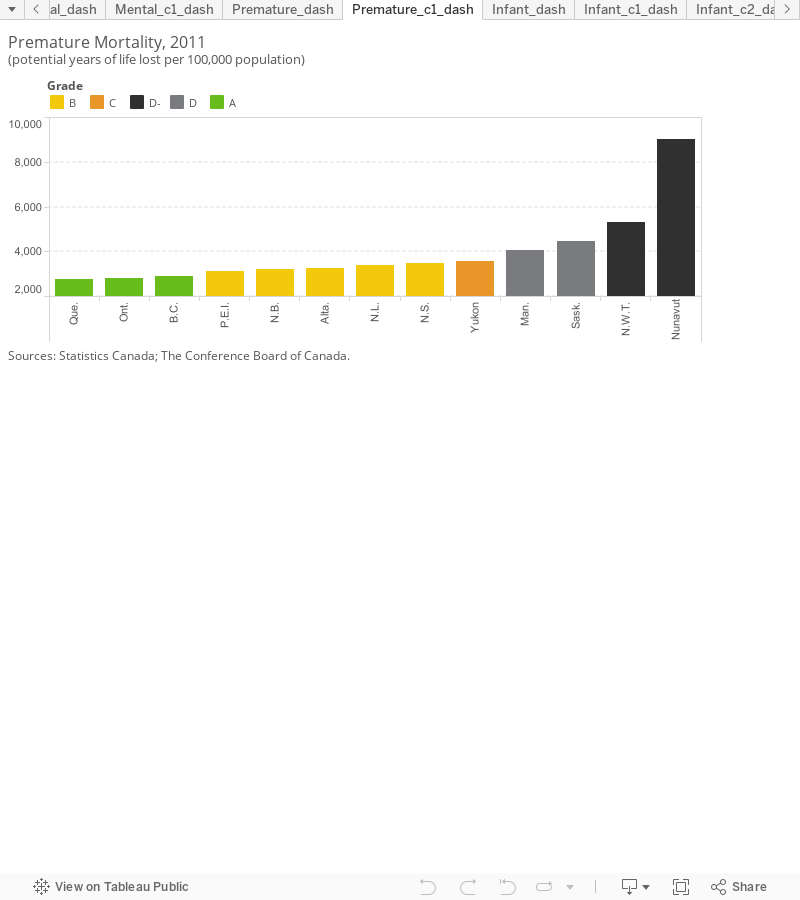
Quebec, Ontario, and B.C. are the top performers among the provinces, with all three provinces scoring “A” grades. Top-ranked Quebec averaged 2,774 years of lost life per 100,000 population in 2011. The poorest-performing provinces—Manitoba and Saskatchewan—had more than 4,000 potential years of lost life per 100,000 population in 2011. Among the territories, Yukon places ahead of Manitoba and Saskatchewan. N.W.T. and Nunavut rank at the bottom. The potential years of lost life in Nunavut were 9,014 per 100,000 population in 2011.
How has the premature mortality rate changed in the provinces and territories over the past 20 years?
Premature mortality rates have trended downward in all provinces. In 1991, Ontario had the lowest rate, at 4,392 potential years of lost life per 100,000 population, and Nova Scotia had the second lowest rate, at 4,541. That same year, P.E.I. posted the highest rate among the provinces, with Quebec, Manitoba, and Saskatchewan doing almost as poorly as P.E.I. on premature mortality. In the territories, 1991 data are available for Yukon only, and its rate of premature mortality that year was higher than all the provinces.
Since the early 1990s, Quebec and P.E.I. have seen the most notable improvement in premature mortality. Quebec posted the lowest premature mortality rate in the country in 2011. In fact, that was the first time in the last 20 years that Quebec finished with a lower premature mortality rate than Ontario. Meanwhile, P.E.I. improved from the province with the highest rate of premature mortality in 1991 to having the fourth lowest rate among the provinces in 2011. Most other provinces have seen gradual improvement in their premature mortality rates over the past 20 years.
Yukon’s improvement on this indicator has been remarkable, as the premature mortality in the territory declined to 3,586 in 2011—lower than the rates in Manitoba and Saskatchewan and on par with Nova Scotia’s mortality rate. N.W.T. and Nunavut have also made notable progress since 1999, the year data first started being collected in these territories. Nonetheless, they are the lowest ranked in Canada on premature mortality.
What accounts for the high premature mortality rates in Manitoba, Saskatchewan, N.W.T., and Nunavut?
Premature mortality rates in Nunavut, N.W.T., Saskatchewan, and Manitoba are the highest in the country. The high shares of Aboriginal people in the territories and in these two provinces might help explain the higher rates of premature mortality. Indeed, the health of Aboriginal people tends to be poorer as a result of factors including lower socio-economic status and higher smoking, alcohol consumption, and obesity rates when compared with non-Aboriginal people.3 In Manitoba, the majority of premature mortality cases are in the northern part of the province,4 where the share of the Aboriginal population is greater. In Saskatchewan, roughly 85.8 per cent of the population in the northern part of the province is Aboriginal, and the premature mortality rate is much higher than in the southern part of the province.5 The share of the Aboriginal population is even higher in the territories, where it represents 51.9 per cent in N.W.T. and 86.3 per cent in Nunavut.
In the territories, accidents and injuries are also more likely to cause premature death because of the remoteness of some communities. As well, these two territories have higher suicide rates. The suicide rate in Nunavut was more than six times the national average in 2011.6 N.W.T.’s suicide rate is more comparable to Manitoba and Saskatchewan’s rate, which is still above the Canadian average.
Footnotes
1 Statistics Canada reports premature mortality using a different definition from the OECD. Statistics Canada considers each death premature if it occurs before the age of 75, while OECD considers deaths before 70 premature. We calculated the premature mortality data for the provinces and territories using the OECD definition so that the data would be comparable to international data. We did so by using “raw” data of the number of deaths by age and by province and territory. For every mortality, if the death occurs before the age of 70, then the difference between 70 and the age at which the death occurred is the number of potential years of life lost. For example, if a person dies at age 20, then he/she will add 50 (70 minus 20) potential years of life lost to the province. The data by province were then age-standardized relative to the 2011 Canadian population. This was done by assuming that each province, across all years, had the same demographic profile as Canada in 2011. Essentially, the age-standardized potential years of life lost for a province was the average of the potential years of life lost across all age groups, where each age group was weighted according to its weight in the 2011 Canada population.
2 Organisation for Economic Co-operation and Development, Health at a Glance 2011: OECD Indicators, 26.
3 Statistics Canada, “Select Health Indicators of First Nations People Living Off Reserve, Métis and Inuit,” Health at a Glance, January 2013.
4 Manitoba Health, Annual Statistics 2010–2011.
5 Northern Saskatchewan Population Health Unit, Northern Saskatchewan Health Indicators Report 2011.
6 Statistics Canada, CANSIM table 102-0563, Leading Causes of Death, Total Population, by Sex, Canada, Provinces and Territories, Annual (accessed October 3, 2014).