
Outward FDI Performance Index
Key Messages
- British Columbia, the top-performing province, earns an “A” for outward greenfield FDI.
- Most of the provinces score “D-” grades, with outward FDI index scores below that of the lowest-ranking peer country, the United States.
- Ontario’s “C” grade may be due to the trend in Canada toward less outward FDI in manufacturing and the decline and demise of some key high-tech companies.
What is FDI?
The International Monetary Fund defines foreign direct investment (FDI) as an investment that allows an investor to have a significant voice in the management of an enterprise operating outside the investor’s own country. The phrase “significant voice” usually means ownership of 10 per cent or more of the ordinary shares or voting power (for an incorporated enterprise) or the equivalent (for an unincorporated enterprise). This may involve either creating an entirely new enterprise—a so-called greenfield investment—or changing the ownership of existing enterprises, via mergers and acquisitions. Other types of financial transactions between related enterprises, such as reinvesting the earnings of the FDI enterprise, are also defined as FDI.
Why focus on greenfield FDI?
Data on total FDI flows are not available for Canada’s provinces because of the challenges associated with compiling FDI data by province. FDI statistics are enterprise-based and are difficult to break down by region. For example, given how organizations are structured, investments in a province via a legal entity or holding company may not reflect the final destination of the investment flow. This issue exists at the international level but is further magnified at the provincial level.
While data on total FDI flows are not available for the provinces, comparable data are available on greenfield FDI—investment that expands an existing facility or creates a new facility. Therefore, in this analysis we focus on inward greenfield FDI. The data are not perfect; however, they do give a sense of which provinces do well when it comes to attracting FDI.1 Given that the same methodology is used to compile both the international and provincial data, we are able to benchmark the provinces’ greenfield FDI in an international context. Five-year averages are used to compute the rankings to account for the extreme volatility of annual FDI data.
What is the outward greenfield FDI performance index?
The outward greenfield FDI performance index captures the relative success of a region in investing in the global economy via greenfield FDI. If a region’s share of global outward greenfield FDI matches its relative share in global gross domestic product (GDP), the region’s outward greenfield FDI performance index is equal to one. A value greater than one indicates a larger share of greenfield FDI relative to GDP share, meaning that the region invests more abroad than its economic size would suggest. A value less than one indicates a smaller share of greenfield FDI relative to GDP share.
How accurate an economic indicator is FDI?
FDI is typically considered to be a significant but lagging indicator of the investment environment. Once a given project or acquisition is decided on, it can take some time for the funds to be delivered. Therefore, examining data on FDI outflows in a given year generally does not provide the full picture on investor sentiment in that particular year. Flows over time should also be considered.
What are the benefits of outward FDI for Canada?
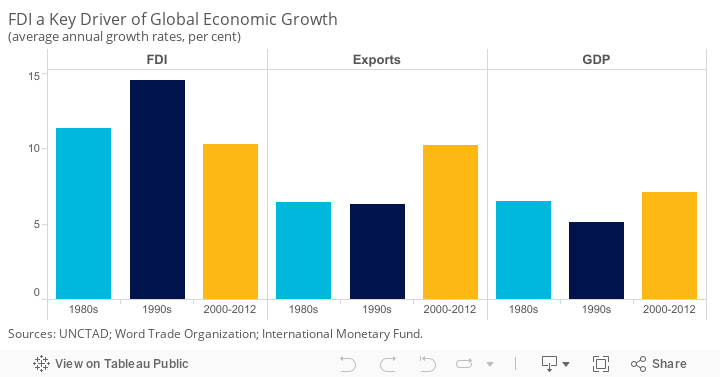
FDI is a key driver of global economic growth, and indeed of globalization. FDI is growing rapidly around the world, driving growth in production, international trade, and global value chains. Over the past three decades, the flow of FDI worldwide has generally outpaced growth in global GDP and in exports. Between 2000 and 2012, global growth in merchandise exports matched that of global FDI growth, but that was due largely to a price effect—the rapid increase in commodity prices during the decade—that is unlikely to be repeated this decade.
FDI outflows open access to foreign markets and promote deeper integration into global supply and value chains, making an economy’s firms more efficient and competitive. Capital-exporting countries receive repatriated profits, intellectual property royalties, and similar payments.
Traditional international trade theory saw FDI as “trade substitution,” a way to avoid tariff barriers, such as by setting up branch plants. The new paradigm—that of “integrative trade”—recognizes that outward FDI promotes trade by developing new exporting (and importing) opportunities. Specifically, FDI tends to increase exports of goods and services from the capital exporting country, while making lower-cost inputs available via imports. For this reason, most developed countries actively promote outward FDI by providing information and technical assistance, risk insurance or guarantees, and loans to multinationals, as well as by participating as co-investors.
To understand the benefits of outward FDI and integrating into global supply chains:
- Direct Investment Abroad: A Strategic Tool for Canada (Ottawa: The Conference Board of Canada, 2011).
- Best Policy Practices for Promoting Inward and Outward Foreign Direct Investment (Ottawa: The Conference Board of Canada, 2010).
How do the provinces stack up against Canada’s peer countries on outward greenfield FDI?
British Columbia ranks third overall and earns an “A” grade on the outward FDI index for 2008–12. B.C. is in the company of two of Canada’s European peers: Switzerland and Ireland. These two relatively small, open economies are heavily integrated in the global economy, and it is not surprising that companies in these countries are engaged in investing abroad. Ireland also earns an “A” grade on the inward greenfield FDI performance index.
Alberta scores a “B” grade, but most other provinces perform poorly on outward FDI. The Atlantic provinces, Manitoba, Saskatchewan, and Quebec all score “D-” grades, with lower outward FDI index scores than the worst-performing peer country, the United States. Ontario scores a “C” grade.
The United States is the largest source of outward FDI in the world—accounting for 24 per cent of world outward FDI in 2012—but earns only a “D” grade and is the worst-performing peer country. Outward FDI from the United States is low given its relative size in the global economy, which remains the largest in the world. The U.S. economy is largely driven by domestic demand while trade and FDI—both inward and outward—make up a relatively small share of the U.S. economy.
The U.S. share of total global outward FDI has declined sharply over the past few decades, dropping from 54 per cent in 1970 to 24 per cent in 2012.
The decline in the U.S. share reflects emerging markets’ increased involvement in the global economy. The share of total global outward FDI from developed countries dropped from 93.1 per cent in 1990 to 79.2 per cent by 2012.
Over the same period, the outward FDI share for emerging markets grew from 6.9 per cent to 18.9 per cent. China’s share of outward FDI increased from only 0.21 per cent in 1990 to 2.2 per cent in 2012.
How do the provinces rank on outward FDI relative to one another?
In addition to ranking the provinces against Canada’s international peers, the provinces have been compared with each other and placed into three categories: “above average,” “average,” and “below average.”2 British Columbia and Alberta are the above average standout performers over 2008–12. Ontario is, not surprisingly, the largest source of outward FDI in Canada, with average outward greenfield FDI investment of $13 billion per year between 2008 and 2012. Average outward FDI for Alberta and British Columbia over the same period was also large (over $5 billion for each province per year). However, since Ontario’s economy is more than twice the size of Alberta’s and British Columbia’s, the province’s share of global outward FDI relative to its share of global GDP is much lower.
Outward FDI played a limited role in the Atlantic provinces, Saskatchewan, and Manitoba, making up less than 0.5 per cent of GDP in these provinces. Nova Scotia, Newfoundland and Labrador, and P.E.I. are all below average performers. P.E.I. is the worst-performing province when it comes to outward FDI: between 2003 and 2012, the province had no measured outward FDI flows.
In which industries are British Columbia and Alberta investing?
There are no data on outward FDI by industry at the provincial level. However, it is possible to gain some insight into the industries that Canada’s two top-performing provinces are investing in by examining national trends in outward FDI.
The economies of B.C. and Alberta are closely linked to resource development. Between 1999 and 2012, the share of outward FDI to mining and to natural gas and oil extraction in Canada grew from 13.6 per cent to close to 19 per cent. It is reasonable to conclude that the growth at the national level is partially explained by the strength of the natural resource sector in B.C. and Alberta. Firms in these provinces involved in mining and in oil and gas extraction are receiving inward FDI to help develop their operations and, in some cases, investing in resource firms in other countries.
What could explain Ontario’s mediocre grade?
Ontario’s “C” grade reflects that fact that outward FDI is not as important a component of the economy as in British Columbia and Alberta. The decline in the importance of outward FDI in Canada’s manufacturing sector could help explain the province’s poor grade. Manufacturing’s share of outward FDI dropped from 28 per cent in 1999 to less than 10 per cent in 2012. Ontario remains the heartland of manufacturing activity in Canada, and this sector’s decline in importance over the past few decades has likely had a negative impact on total outward FDI from the province.
Significant changes in Canada’s high-technology sector have also been a factor in Ontario’s poor grade for outward FDI. The information and communications technology sector’s share of outward FDI for Canada fell from a high of 14 per cent in 2000 to only 2 per cent in 2012. Ontario-based Nortel’s demise was the key factor behind the collapse in this sector’s outward FDI share. The problems now facing BlackBerry suggest that Ontario’s grade for outward FDI could remain low for a considerable time.
How does Canada rank on total outward FDI?
Canada fell from a “C” grade in the 1970s and 1980s to a “D” in the 1990s and 2000s. The key to understanding Canada’s “D” grade is to compare how its outward FDI performance stacks up against that of its competitors. Canada’s share of global total outward FDI flows fell from a high of 10.8 per cent in 1981 to 3.9 per cent in 2012. Yet its share of world outward FDI in 2012 was still 1.5 times its share of world GDP, which means it was still playing a larger role in outward FDI than its economic size would warrant.
So why does Canada not earn a higher grade on this indicator? The answer is simple: Other countries are doing relatively better. Ireland—the top performer in 2012 on total FDI outflows—accounted for only 0.3 per cent of global GDP but 1.4 per cent of global outward FDI, which means that its share of world outward FDI was over 4.5 times its share of world GDP.
Like Canada, the U.S. is also a “D” grade performer on the total outward FDI performance index. Why? Because the U.S. should be doing better relative to its economic size. In 2012, the U.S. accounted for 22.4 per cent of world GDP and 23.6 per cent of global outward FDI, resulting in an outward FDI performance index of 1.1, which is low relative to its peers.
What countries does Canada invest in?
The geographic pattern of Canada’s stock of FDI in other countries has changed over the past two decades. While the U.S. remains the most important single destination for Canadian outward FDI, its share declined from 66 per cent in 1987 to 41 per cent in 2012. Europe’s share increased from 17 per cent of Canadian outward FDI stock in 1987 to 26 per cent in 2012. The U.K. is the most attractive location for Canadian FDI in Europe.
Canada is still not taking enough advantage of opportunities outside traditional North American and European countries. For example, Canada’s stock of FDI in Asia and Oceania has grown, but still represents less than 10 per cent of its overall FDI abroad.
Why is outward FDI not always viewed positively?
Until the 1970s, outward FDI was generally thought to be detrimental to the growth of the home or capital-exporting countries. Multinational enterprises were viewed as depriving the local capital pool of additional growth and employment by investing abroad. As a result, many countries had foreign exchange controls or limits on outflows of capital. Even today, there are occasional demands to introduce “runaway plant” legislation to restrict the exporting of jobs. Over the past two decades, the U.S. Congress has sometimes faced public pressure for legislation to prevent U.S. companies from investing outside the country, thereby “destroying” U.S. jobs.
However, with trade liberalization and the rise of global supply chains, FDI has increasingly become a much sought-after means of generating wealth and stimulating trade—in both directions. In other words, international opinion has shifted significantly; the perceived benefits of FDI are now seen as far outweighing its drawbacks. This is fundamentally changing the way we look at trade and investment, as well as the relationships between them. Indeed, in future we should perhaps speak less in terms of “international trade and investment”—and more about “international investment and trade.” Canadian firms should be not only attracting more FDI but also doing more to facilitate growing outflows of FDI.
Footnotes
1 The company fDi Markets is the source of the provincial data and of the greenfield data published in UNCTAD’s annual World Investment Report. fDi Markets does not track the equity participation by investors. This means the data may include investments that are not qualified as FDI (i.e. the level of foreign ownership is less than 10 per cent).
2 To compare the performance of Canadian provinces relative to one another, we first determined the average score and standard deviation of the provincial values. The standard deviation is a measure of how much variability there is in a set of numbers. If the numbers are normally distributed (i.e., the distribution is not heavily weighted to one side or another and/or does not have significant outliers), about 68 per cent will fall within one standard deviation above or below the average. Any province scoring one standard deviation above the average is “above average.” Provinces scoring less than the average minus one standard deviation are “below average.” The remaining provinces are “average” performers.