
Life Expectancy
Key Messages
- Canada maintains its “B” grade and 6th-place ranking among 17 peer countries.
- The gap in life expectancy between Canada and the U.S. continues to widen; Canadians now live three years longer than Americans.
- Life expectancy is a good indicator of overall health in a country.
Putting life expectancy in context
An average person living during the time of the Roman Empire might have expected to live 25 years. At the turn of the 20th century, an individual had a life expectancy of 50 years. In 2009, the estimated average life expectancy in Canada and its peer countries was 81 years.1
Life expectancy measures the average number of years a baby born today can be expected to live. It is widely regarded as an indicator of a country’s overall health. Life expectancy has increased dramatically for most people in the world today, except those living in AIDS-ravaged sub-Saharan Africa. Improvements in sanitation, nutrition, medicine, and medical technology have all helped increase life expectancy.
Do Canadians live longer, on average, than their peers in other countries?
Life expectancy in Canada is slightly higher than the average among the countries ranked here. The average Canadian born in 2009 can be expected to live 81.2 years. Five countries have higher life expectancies than Canada—83 years in Japan, 82.3 years in Switzerland, 82.1 years in Italy, 81.6 years in Australia, and 81.4 years in Sweden. The average American will live to be just over 78.
Have there been any notable changes in the country rankings since the last report card?
Netherlands moved ahead of Austria into 9th place—a two-place jump from its 11th-place ranking in the last report card. The U.K. made an even more impressive improvement, moving up five spots from 15th to 10th place among the 17 countries. The U.K.’s life expectancy increased from 79.5 in 2006 to 80.4 in 2009.
How much longer do Canadians live now compared with five decades ago?
In 1961, the average Canadian could expect to live to age 71, 10 years less than the current estimated life expectancy. Canada’s peer countries have also experienced a steady increase in life expectancy, with Japan seeing the greatest improvement. In 1961, Japan’s life expectancy was 68 years; now it’s 83 years.
The gap in life expectancy between Canada and the U.S. continues to widen—the average Canadian can now expect to live three years longer than the average American.
How have the relative rankings changed?
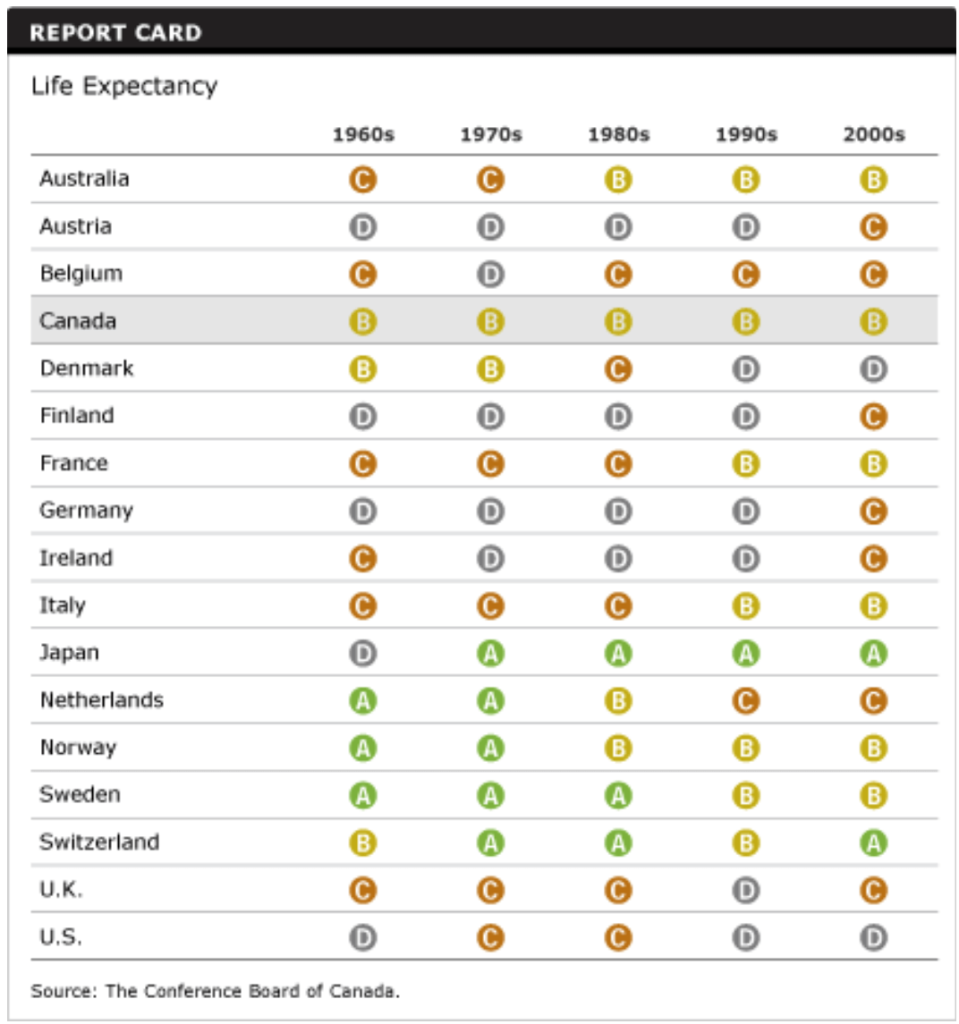
Canada has earned a steady “B” on this indicator for nearly five decades. Japan’s impressive increase in life expectancy has set a high bar for attaining an “A” grade on average in this decade, a standard that only Switzerland has met. Moreover, Japan, which had among the lowest life expectancies in the 1960s, has been a steady “A” performer ever since. Of the five top-ranked countries in the 1970s, only Japan has been able to consistently maintain its “A.” Switzerland dropped to a “B” in the 1990s, but regained its “A” ranking in the 2000s.
The Netherlands, Norway, and Sweden, on the other hand, have all lost their top-ranking status.
The U.S. has also seen a decline in its relative performance. It earned a “C” in the 1970s and 1980s and dropped to a “D” in the 1990s, where it has remained.
Countries that have jumped from being “D” to “C” grade performers since the 1990s include Austria, Finland, Germany, Ireland, and the United Kingdom.
What role does wealth play in life expectancy?
Economics plays a critical role in life expectancy. On average, people in high-income countries live 23 years longer than people in low-income countries.2 The average life expectancy in Canada and its peer countries—among the richest in the world—is 81 years. People in Africa live, on average, to age 54, while people in Southeast Asia live to age 65.3
Similarly, within a country, wealthier people generally have a longer lifespan than poorer people. Canada has notable regional discrepancies. Annual mortality rates are higher in the most rural areas (those with no commuters) than in urban areas, according to findings from the Canadian Institute for Health Information. “Areas with a higher life expectancy generally have higher incomes, higher levels of education, and higher levels of employment. Other factors associated with better health for a population include a more equitable distribution of income, better housing, a supportive social environment, and good opportunities for early childhood development.”4
Conversely, the Aboriginal population has a much lower life expectancy than the total Canadian population. “Studies have shown that Aboriginal people in Canada have life expectancies that are five or more years less than those of the total Canadian population.”5
Is life expectancy the best indicator to describe the health dimension of quality of life?
The life expectancy indicator has sometimes been criticized as placing too much emphasis on quantity of life and not enough on quality of life. To address that issue, the life expectancy report card indicator is complemented by the premature mortality and self-reported health status indicators.
Another indicator that is often used to account for quality of life is health-adjusted life expectancy, or HALE. HALE is the average number of years a person can expect to live in good health.
Instead of considering all years of life as equal, as in the conventional life expectancy indicator, the HALE weights years of life according to health status. HALE is calculated by subtracting from life expectancy the average number of years in ill-health weighted for severity of the health problem.
In 2007, the most recent year for which HALE data are available, Canada’s general life expectancy was 80.7 years, but the average number of years that Canadians could expect to live in full health was 73 years. This means that the average Canadian spends 90.5 per cent of his or her life in good health.6
Footnotes
1 The 2009 data on life expectancy were not available for the Canada and Italy. These data were calculated by projecting the most recent year of data using a 10-year average annual growth rate.
2 World Health Organization, World Health Statistics 2011 (Geneva: WHO, 2008), 54.
3 Ibid.
4 Canadian Institute for Health Information, Health Care in Canada 2000: A First Annual Report (Ottawa: CIHI, 2000), 6.
5 Ibid.
6 World Health Organization, World Health Statistics 2010 (accessed November 3, 2011).