
Adults With High-Level Literacy Skills
Key Messages
- Overall, Canada earns a “C” grade on high-level literacy skills in the latest international comparison study.
- Fourteen per cent of Canadian adults score at the highest levels for literacy skills—a significant decrease from a decade ago.
- Only Alberta and British Columbia earn a “B” grade for high-level literacy skills, while all other provinces earn a “C” or “D.”
Why are literacy skills important?
Literacy skills—along with numeracy skills and problem-solving skills in a technology-rich environment—affect both economic and social well-being.
Given the centrality of written communication and basic mathematics in virtually all areas of life, coupled with the rapid integration of ICT [information and communications technology], individuals must be able to understand, process, and respond to textual and numerical information, print and digital, if they are to participate fully in society—whether as citizens, family members, consumers, or employees.1
Literacy proficiency affects an individual’s ability to find and keep a job and earn higher wages.2 It is also critical for businesses because it underpins innovative capacity. High-level literacy skills—along with technical and other higher-order skills—allow for the transformative processes of innovation to occur. Firms consistently rate employee skills as one of the top four factors needed for innovation success.3
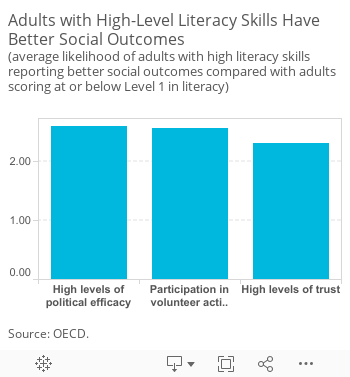
But adequate literacy skills, numeracy skills, and problem-solving skills in a technology-rich environment are not only an economic issue; they have profound social consequences as well. The results from the PIAAC show that adults with high-level literacy skills at least twice as likely to report high levels of trust and political efficacy, good health, and participation in volunteer activities, even after adjusting for age, gender, educational attainment, and immigrant and language background.4
How are literacy skills measured?
For the purposes of the PIACC test, literacy skills are defined as “the ability to understand, evaluate, use and engage with written texts to participate in society, to achieve one’s goals, and to develop one’s knowledge and potential.”5 This requires “accessing, identifying, and processing information from a variety of texts that relate to a range of settings.”6
In the latest international comparison study, the literacy skills of adults between the ages of 16 and 65 in each participating country were assessed over a continuum of ability using a measurement scale ranging from 0 to 500. The scores were then divided into six proficiency levels: Levels 1 through 5 plus below Level 1. The Conference Board regards adults as having high-level literacy skills if they test at levels 4 or 5.
A person should have at least level 3 literacy to function well in Canadian society, according to Employment and Social Development Canada.7 Individuals with higher-level literacy skills (i.e., level 4 or 5) can go further to “undertake tasks that involve integrating information across multiple dense texts and reasoning by inference.”8
How do Canada and the provinces rank relative to international peers?
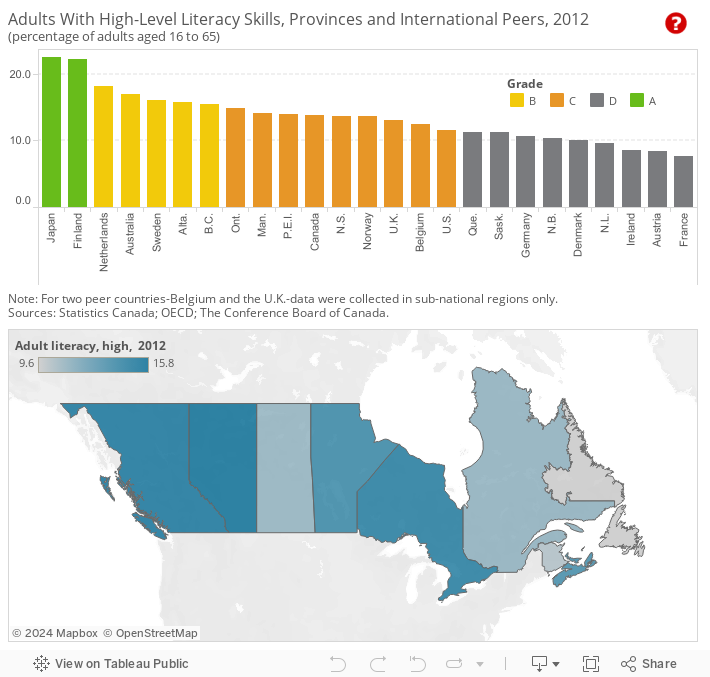
Overall, Canada earns a “C” grade on the share of adults with high-level literacy skills in the latest international comparison study. Fourteen per cent of Canadian adults are considered to have high-level literacy skills, placing Canada above the OECD average of 12 per cent, but well below the top-ranking peer countries.9
Breaking the study results down by province reveals that no province earns an “A” grade for high-level literacy skills, and only Alberta and British Columbia earn “B”s. Ontario, Manitoba, Prince Edward Island, and Nova Scotia each earn a “C” grade. The remaining provinces (i.e., Quebec, Saskatchewan, New Brunswick, and Newfoundland and Labrador) earned “D”s.
Internationally, only Japan and Finland earn “A”s for the proportion of their adult population with high-level literacy skills. Australia, the Netherlands, and Sweden each earn a “B” grade on this indicator—a higher grade than that earned by Canada as a whole and matched by only two provinces.
How do the provinces perform relative to each other?
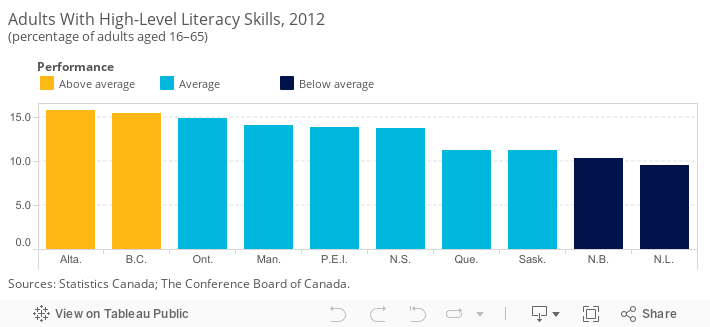
In addition to ranking the provinces against Canada’s international peers, the provinces have been compared with each other and placed into three categories: “above average,” “average,” and “below average.” 10
The results are mixed. Alberta and British Columbia are considered above-average performers, while Newfoundland and Labrador and New Brunswick, each with less than 11 per cent of adults with high-level literacy skills, are below-average performers.
How do immigrants perform on the literacy test?
Canada has a diverse population. According to data from the 2011 National Household Survey, 22 per cent of the population aged 16–65 are immigrants.11 Immigrants are not evenly dispersed across the country. Eighty-five per cent of all immigrants to Canada live in three provinces: Ontario (53.3 per cent), British Columbia (17.6 per cent), and Quebec (14.4 per cent). The remaining 15 per cent of immigrants live in the other seven provinces and three territories.12
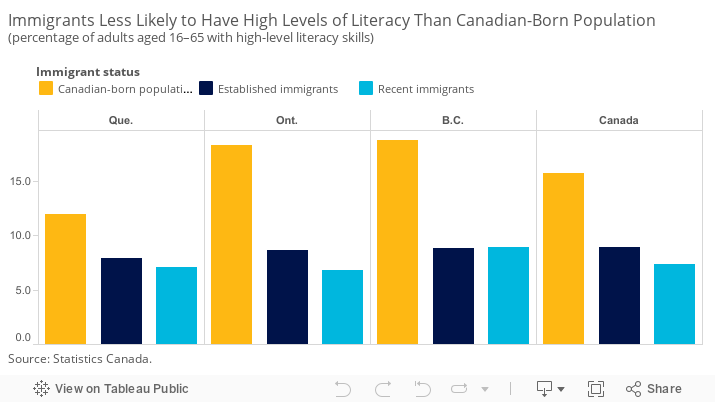
It is important to assess how immigrants are faring on skills, particularly in those three provinces where immigrants account for a large portion of the working-age population. In general, a much smaller proportion of the immigrant population have high-level literacy skills than the Canadian-born population. For example, in Ontario, the province with the highest share of immigrants, only 6.8 per cent of recent immigrants (those arriving in Canada within the last 10 years) have high-level literacy skills. This does not mean that these immigrants have poor literacy skills in their native language; however, they are performing poorly in one of Canada’s official languages, either English or French.
Time lived in Canada has some impact on the share of immigrants with high literacy; in Ontario, the share increases to 8.6 per cent for immigrants who have lived in Canada for more than 10 years. The share, however, is still much lower than the 18.3 per cent for those born in Canada.
These general results hold in the other two provinces with large immigrant population and for Canada as a whole. The one exception is that recent immigrants outperform established immigrants in British Columbia.
How do Aboriginal people fare on the literacy test?
The Aboriginal population in Canada is growing. In 2011, 4.3 per cent of the Canadian population identified as Aboriginal on the National Household Survey, up from 3.3 per cent in 2001.13 About 61 per cent of Aboriginal people identified as First Nations (with about half of those individuals living on reserves), 32 per cent identified as Métis only, and 4.2 per cent identified as Inuit only.14 It is also important to note that almost 15 per cent of Aboriginal people report having an Aboriginal language as their mother tongue, likely affecting their performance on the PIAAC tests, which are administered in only English or French.15 PIAAC oversampled the Aboriginal population to better assess the skills of this diverse population. Only Aboriginal people living off reserve participated in the test.16
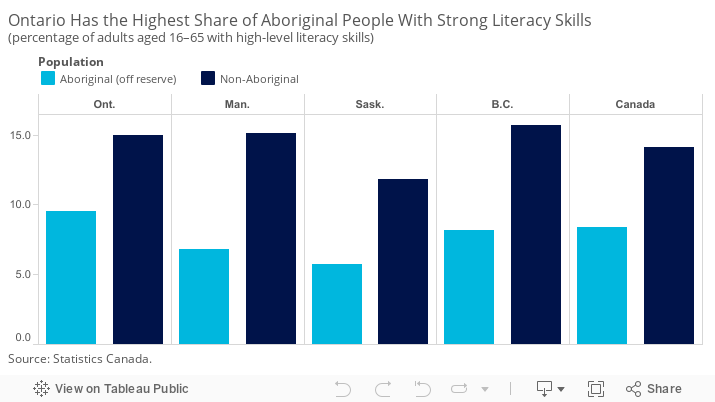
Detailed data are available on the performance of Aboriginal people in Canada as a whole and in four provinces: Ontario, Manitoba, Saskatchewan, and British Columbia. Overall, Aboriginal people are much less likely to have high-level literacy skills than the non-Aboriginal population. The gap is highest in Manitoba, where 15.1 per cent of the non-Aboriginal population have high-level skills compared with 6.8 per cent of the Aboriginal population. The gap is smallest in Ontario.
While the gap is alarming, it is promising to note that Aboriginal and non-Aboriginal people with similar levels of education have similar literacy skills levels.17 Clearly, improving education outcomes is an important factor in improving the skills of the Aboriginal population. However, much more thorough and sensitive analysis is needed to fully understand both the reasons for the gap and the actions and policies needed to close the gap.
Have high-level literacy rates changed over time?
International comparisons of adult literacy skills have been conducted from time to time over the past two decades. Unfortunately, a direct comparison among the results is not possible for a number of reasons, including the fact that the concept of literacy has changed to reflect the new reality of digital texts.18 However, Statistics Canada re-estimated and re-scaled the data from the 2003 Adult Literacy and Life Skills Survey (ALL) to enable comparison at the Canada level only. Further work is being done to permit more detailed breakdowns by province.19 The re-estimated data reveal that, in 2003, 18 per cent of adults had high-level literacy skills.20 That number dropped to 14 per cent in 2012. Despite efforts to improve adult literacy rates in Canada, high-level literacy outcomes have eroded in the past 10 years.
Footnotes
1 Statistics Canada, Employment and Social Development Canada, and Council of Ministers of Education, Canada, Skills in Canada: First Results From the Programme for the International Assessment of Adult Competencies, Catalogue no. 89-555-X (Ottawa: Statistics Canada, 2013), 5.
2 OECD, OECD Skills Outlook 2013: First Results From the Survey of Adult Skills (Paris: OECD, 2013), 24.
3 Douglas Watt and Daniel Munro, Skills for Business Innovation Success: It’s People Who Innovate. (Ottawa: The Conference Board of Canada, 2014), 15.
4 OECD, OECD Skills Outlook 2013: First Results From the Survey of Adult Skills (Paris: OECD, 2013), 27.
5 Ibid., 59.
6 Ibid., 8.
7 Employment and Social Development Canada, Learning—Adult Literacy.
8 Statistics Canada, Employment and Social Development Canada, and Council of Ministers of Education, Canada, Skills in Canada: First Results From the Programme for the International Assessment of Adult Competencies, Catalogue no. 89-555-X (Ottawa: Statistics Canada, 2013), 15.
9 Ibid.
10 To compare the performance of Canadian provinces relative to one another, we first determined the average score and standard deviation of the provincial values. The standard deviation is a measure of how much variability there is in a set of numbers. If the numbers are normally distributed (i.e., the distribution is not heavily weighted to one side or another and/or does not have significant outliers), about 68 per cent will fall within one standard deviation above or below the average. Any province scoring one standard deviation above the average is “above average.” Provinces scoring less than the average minus one standard deviation are “below average.” The remaining provinces are “average” performers.
11 Statistics Canada, Employment and Social Development Canada, and Council of Ministers of Education, Canada, Skills in Canada: First Results From the Programme for the International Assessment of Adult Competencies, Catalogue no. 89-555-X (Ottawa: Statistics Canada, 2013), 46.
12 Statistics Canada, Immigration and Ethnocultural Diversity in Canada, Catalogue no. 99-010-X (Ottawa: Statistics Canada, 2014).
13 Statistics Canada, Aboriginal Peoples in Canada, Catalogue no. 99-011-X (Ottawa: Statistics Canada, 2014).
14 Ibid.
15 Statistics Canada, Aboriginal Peoples and Language, Catalogue no. 99-011-X (Ottawa: Statistics Canada, 2014).
16 Of the 1,400,685 people with an Aboriginal identity in 2011, about 1,086,319 (78 per cent) lived off reserve.
17 Council of Ministers of Education, Canada, “PIAAC in Canada,” Slide Presentation, 2013.
18 Statistics Canada, Employment and Social Development Canada, and Council of Ministers of Education, Canada, Skills in Canada: First Results From the Programme for the International Assessment of Adult Competencies, Catalogue no. 89-555-X (Ottawa: Statistics Canada, 2013), 53.
19 Ibid., 55.
20 Ibid., 99.