
Mortality Due to Cancer
Key Messages
- B.C. and Alberta have the lowest rates of cancer deaths in the country and score “A” grades.
- Nunavut, Yukon, and the Northwest Territories all score “D-” grades on mortality due to cancer, ranking below the worst-performing peer country, Denmark.
- Lung cancer still kills more Canadians than any other type of cancer; breast cancer is the number two killer among Canadian women.
Putting mortality due to cancer in context
As he set off on his “Marathon of Hope” in 1980, Canadian icon Terry Fox imagined what could happen if Canadians put their support behind cancer research. Since then, Canada has made great strides in cancer care. But unfortunately, cancer is still the leading cause of premature death in Canada. The rising number of Canadians diagnosed with cancer continues to put significant demands on health systems. Progress on preventing cancer and improving its management is still unpredictable, making it an ongoing health care challenge for governments at home and abroad.
The impact that cancer has on the lives of patients, their families, and the health care system cannot be overstated. The long-term emotional, physical, and psychological strain on individuals diagnosed with cancer—and their families—is profound. Just about everyone in Canada has been touched by cancer in some way. Every hour, nine people die from cancer.1 Each year, the number of Canadians diagnosed with cancer increases. In 2014, an estimated 191,300 Canadians were diagnosed and 76,600 died of cancer.2
The cost of cancer care also places a heavy burden on the economy. One estimate found that over the next 30 years, 2.4 million workers will get cancer and 872,000 will die from the disease.3 Cancer cost the Canadian economy $4.4 billion in 2008 in direct health care costs—that is, drug, physician, and hospital spending—and indirect costs—that is, lost productivity associated with illness, injury, and premature mortality.4, 5
Cancer continues to exact a huge toll on the lives of Canadians; the country must not lag behind its peer countries in its efforts to reduce the incidence and mortality of cancer.
How do the provinces and territories rank relative to Canada’s international peers?
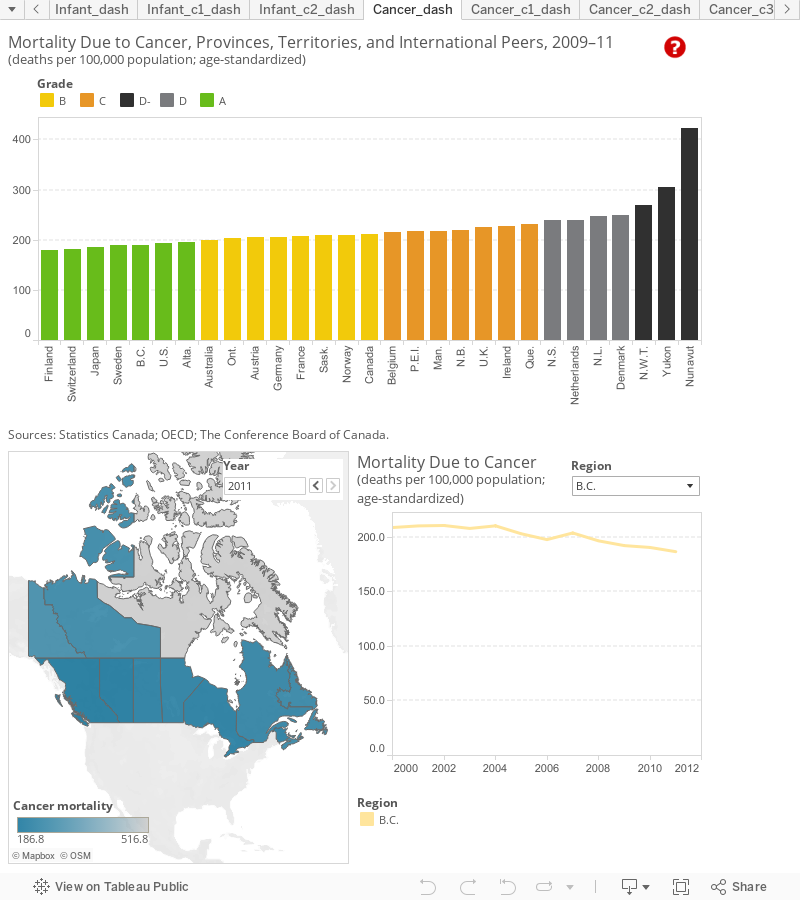
Across the provinces, mortality due to cancer is lowest in B.C., where the province’s 189.9 deaths per 100,000 population between 2009 and 2011 earns it an “A” grade, behind only Finland, Switzerland, Japan, and Sweden. B.C. is not the only province to garner a top grade. Alberta’s average of 194.5 deaths per 100,000 population also scores the province an “A” grade and places it just below the U.S. average.
Overall, Canada scores a “B” grade and ranks 11th among the 16 peer countries. Mortality rates in Ontario and Saskatchewan were below the Canadian average—both provinces also score “B” grades. Newfoundland and Labrador, Nova Scotia, and Quebec had the highest average mortality rates among the provinces. The territories rank the lowest on mortality due to cancer and score “D-” grades, ranking below the bottom-ranked peer country, Denmark. Yukon and Nunavut had an astounding 304.2 and 423.5 deaths per 100,000 population, respectively, between 2009 and 2011.
How do the provinces and territories perform relative to each other?
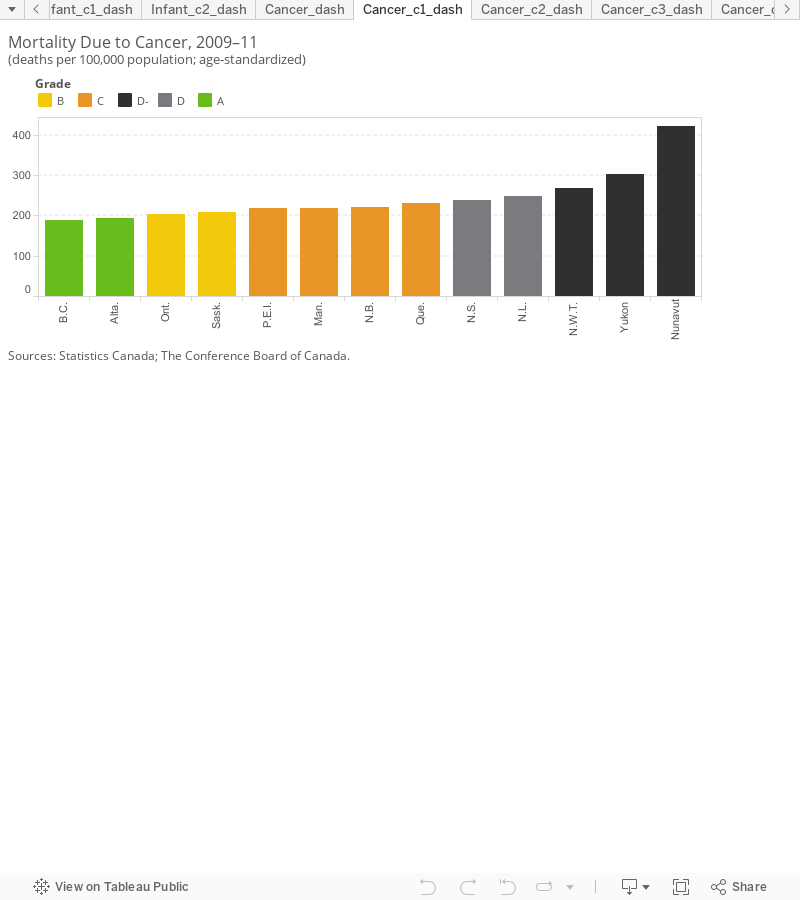
B.C. and Alberta, with the lowest mortality rates in the country, are the only two provinces with “A”s on mortality due to cancer. Most provinces get “B” and “C” grades. Newfoundland and Labrador is the worst-ranked province, scoring a “D.” The territories have the highest cancer mortality rates in Canada.
What kinds of cancers contribute most to mortality rates in Canada?
 Lung cancer, colon cancer, breast cancer, and prostate cancer account for about 50 per cent of all cancer deaths. Lung cancer remains the leading cause of cancer death in Canada, accounting for 27 per cent of cancer deaths in both men and women.6
Canada gets a “D” for mortality due to lung cancer. The average number of deaths between 2009 and 2011 was 56.6 people per 100,000 population, nearly twice the rate of top-ranked Sweden (31.6 people per 100,000 population). The effects of Canadians’ past smoking habits are reflected in the high number of deaths from lung cancer. Paradoxically, Canada also has one of the lowest smoking rates among peer countries. There is often a long interval between exposure to risk factors such as smoking and the point at which a cancer is detected. Given that smoking rates are now much lower in Canada, lung cancer mortality rates are expected to decrease over the next decades.
Currently, no Canadian province scores better than a “C” grade on lung cancer mortality. Across the provinces, rates of lung cancer deaths are highest in the eastern part of the country. Quebec and the Atlantic provinces all have rates higher than the Canadian average and get “D-” grades. This is not surprising, as these provinces have some of the highest smoking rates in the country. B.C., Alberta, and Ontario have the lowest rates of lung cancer deaths, and although Manitoba and Saskatchewan perform better than the Canadian average, they earn “D” grades. Nunavut is the worst performer on lung cancer with an astounding 199.4 deaths per 100,000 population from 2009 to 2011, more than double the rate in Yukon and triple the rate in N.W.T. All three territories score “D-” grades on lung cancer mortality.
Colon cancer is the second leading cause of cancer deaths in men in Canada and the third leading cause of cancer deaths in women. Overall, Canada scores a “B” grade on mortality due to colon cancer, ranking relatively high compared to its peers. P.E.I., New Brunswick, Alberta, B.C., and Saskatchewan all score “A” grades. In P.E.I, there were only an average of 19.3 deaths due to colon cancer per 100,000 population between 2009 and 2011, well below the average Canadian rate of 23.3.
Newfoundland and Labrador and the territories all score “D-” grades on colon cancer mortality. The three-year average mortality due to colon cancer rate in Newfoundland and Labrador was 34.1. The rates in the territories were even higher, with Nunavut at the bottom with an average of 42.4 deaths per 100,000 population from 2009 to 2011.
In Canada, breast cancer is the second leading cause of cancer deaths in women, accounting for almost 14 per cent of cancer deaths.7 Canada scores a “C” grade on this indicator, with a three-year average of 26 breast cancer deaths per 100,000 female population. Japan is the best-ranked peer country, with nearly half (14) the number of breast cancer deaths per 100,000 female population.
The rates of mortality due to breast cancer do not differ much among the provinces. Most provinces earn “C” grades. B.C. and Alberta are the top-ranked provinces, scoring “B” grades. Newfoundland and Labrador is the only province to earn a “D” on this indicator. In the territories, Nunavut is an “A+” performer on breast cancer, ranking ahead of the top-ranked peer-country, Japan. An average of only 2.7 women in Nunavut per 100,000 female population died of breast cancer from 2009 to 2011. N.W.T. also does well on this indicator, scoring a “B” and ranking ahead of the top-performing province, British Columbia. Yukon is, is the worst performer, scoring a “D-” with the highest average mortality rate due to breast cancer between 2009 and 2011.
Are lung cancer incidence rates decreasing?
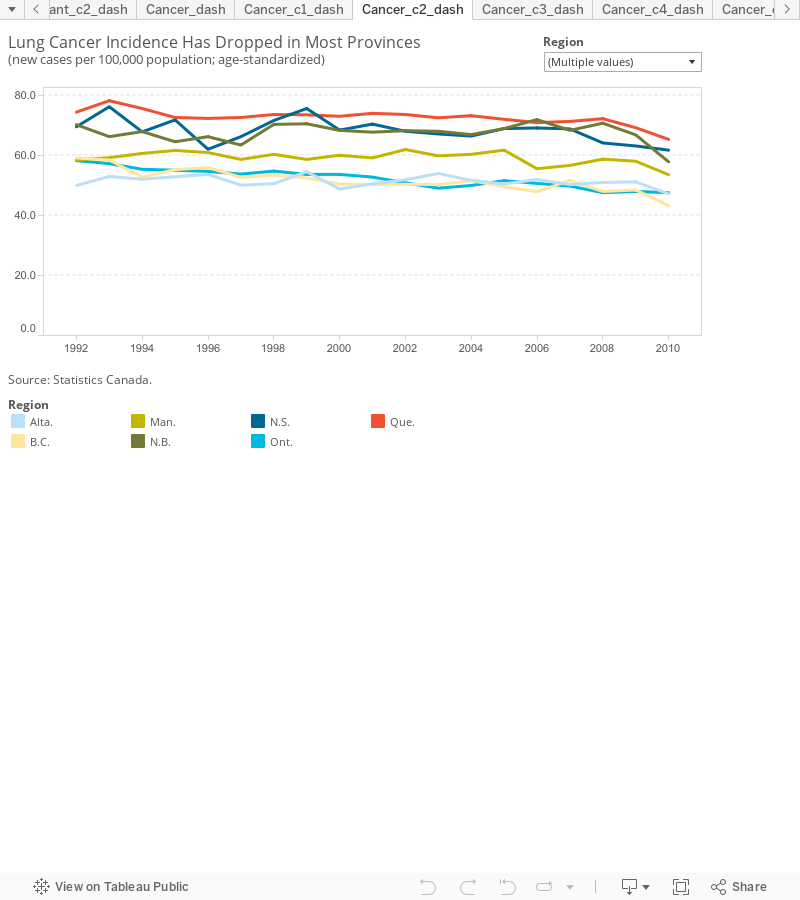
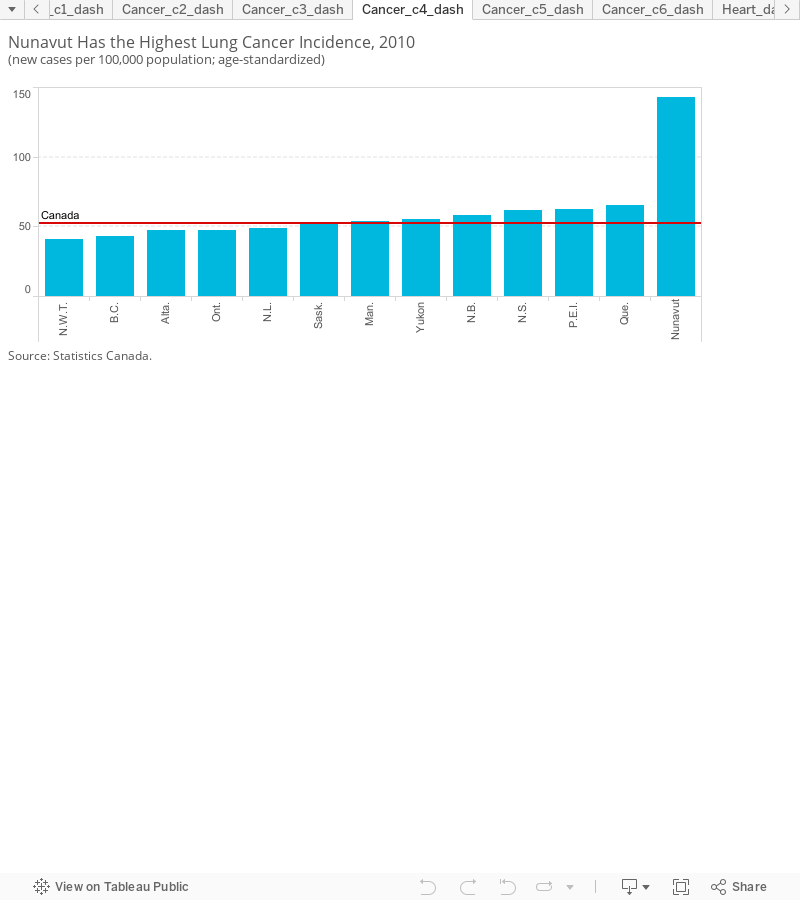
Overall in Canada, the incidence of lung cancer has seen the sharpest drop of any cancer since 1992. Indeed, the Canadian average of new cases of lung cancer fell from 62.2 per 100,000 population in 1992 to 52.6 per 100,000 population in 2010. B.C. witnessed the most impressive drop in lung cancer incidence among the provinces. New Brunswick and Ontario have also made huge strides. Even Quebec has significantly improved its rate of new lung cancer cases. But Newfoundland and Labrador, P.E.I., and Saskatchewan are moving in the wrong direction, as the number of new lung cancer cases in these provinces has actually increased since 1992.
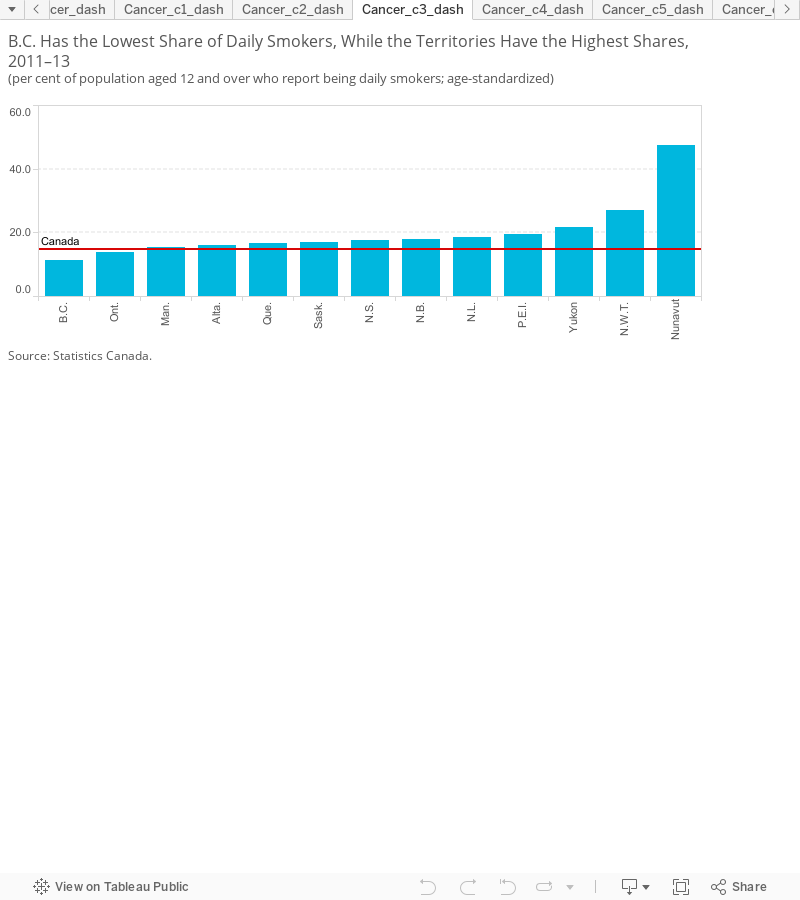
Falling lung cancer incidence is due to the decline in smoking rates. In 2013, 14.2 per cent of Canadians aged 12 and older smoked cigarettes every day—an almost 4 percentage point drop in the last 10 years.8 B.C. had the lowest lung cancer incidence rate among the provinces in 2010. It is also the province with the lowest smoking rate: 11 per cent of the population above 12 years of age smoked daily in 2013. Alberta and Ontario also have low lung cancer incidence rates relative to the other provinces. In Ontario, 13 per cent of the population were daily smokers in 2013.
Most provinces have experienced a decline in lung cancer incidence that has coincided with a decline in smoking rates. Newfoundland and Labrador, P.E.I., and Saskatchewan, the three provinces that had higher lung cancer incidence rates in 2010 than in 1992, also have smoking rates above the Canadian average.
Nunavut cut its rate of new lung cancer cases by more than half between 1992 and 2010. But at 143 new cases per 100,000 population, its current incidence rate is the highest in the country and more than double that of the worst-ranked province, Quebec (65.5 new lung cancer cases per 100,000 population). The other two territories fare much better on lung cancer incidence—N.W.T. has the lowest rate of new lung cancer incidence in Canada, while Yukon finishes ahead of New Brunswick, P.E.I., Nova Scotia, and Quebec, even though its lung cancer incidence rate has increased since 1992. One reason why lung cancer incidence may be so low in N.W.T. is that cancer detection often occurs too late—41 per cent of lung cancers in the territory are detected in stage 4.9
Smoking rates in the territories are much higher than the Canadian average. The proportion of the population above 12 years of age who smoked daily in Nunavut was 47.8 per cent in 2013, compared with 14.2 per cent for Canada as a whole. Although smoking rates are much lower in Yukon and N.W.T. (18.9 per cent and 25.3 per cent, respectively), they remain well above the Canadian average. However, similar to the provinces, smoking rates are coming down in the territories.
What about the incidence of colon cancer and breast cancer?
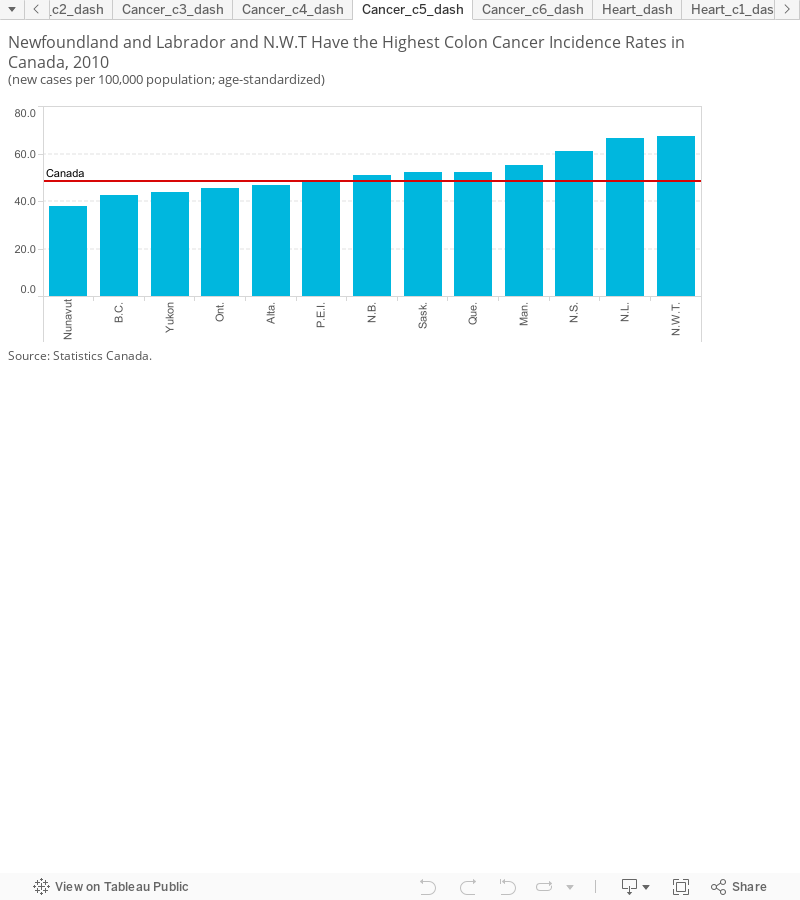
Incidence of colon cancer has also been trending downward in Canada since 1992, but at a much slower rate than the incidence of lung cancer. There were 48.4 new cases of colon cancer per 100,000 population in 2010, down slightly from 53.3 in 1992.
B.C., Alberta, and Saskatchewan had the lowest rates of colon cancer incidence among all the provinces in 1992. But incidence rates have gone up in Alberta and Saskatchewan, and now Ontario has the second-lowest rate of colon cancer incidence among the provinces, after B.C.
Nunavut and Yukon continue to post among the lowest rates of colon cancer incidences; however, they had the highest average colon cancer mortality rates between 2009 to 2011. The low incidence rate in the territories could be associated with inadequate screening. The proportion of the population 50 years and over who have not been screened for colon cancer is highest in the territories.10
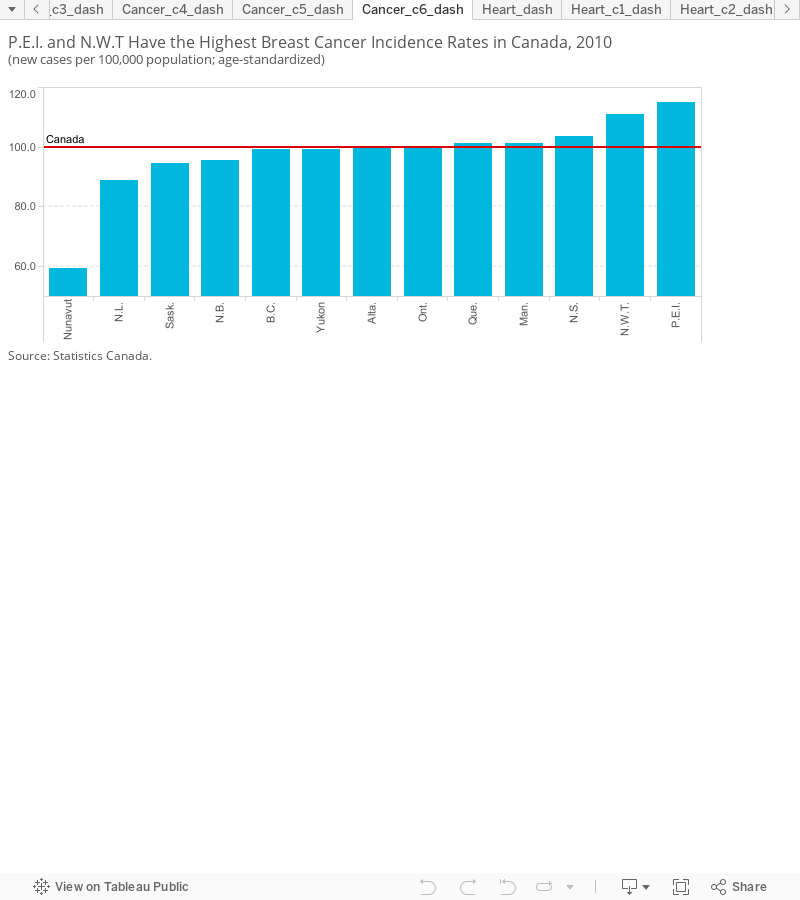
Thanks to the role of breast cancer screening in women and advances in breast cancer treatment, nearly 24,000 deaths have been avoided since the female breast cancer death rate peaked in 1986.11 But even with mortality due to breast cancer steadily trending downward in Canada, there has not been of a huge reduction in new breast cancer cases. This is partly due to a rise in screening for breast cancer since the late 1980s. In 2010, 100 new breast cancer cases per 100,000 female population were diagnosed in Canada, roughly the same rate as the previous 15 years.
Newfoundland and Labrador continues to post the lowest rate of breast cancer incidence among all the provinces. Interestingly, the Maritime provinces and Quebec have seen a rise in new breast cancer cases since 1992, while the remaining provinces have seen a reduction in new breast cancer cases.
In the territories, Nunavut had the lowest rate of new breast cancer incidence in the country in 2010, while N.W.T. had the second-highest incidence rate. Yukon’s breast cancer incidence rate was just below the Canadian average. Over the past decade, the rate of breast cancer incidence has gone up significantly in both Yukon and N.W.T. Conversely, incidence rates have gone down in Nunavut.12
Footnotes
1 Canadian Cancer Society, Canadian Cancer Statistics 2014, May 2014, 37 (accessed September 25, 2014).
2 Ibid, 6.
3 Paul Smetanin and Paul Kobak, Interdisciplinary Cancer Risk Management: Canadian Life and Economic Impacts (Toronto: RiskAnalytica, 2005), (accessed February 9, 2012).
4 Public Health Agency of Canada, Economic Burden of Illness in Canada 2005–2008 (Ottawa: Public Health Agency of Canada, March 2014), 12.
5 Ibid, 3.
6 Canadian Cancer Society, Canadian Cancer Statistics 2014, May 2014, 38 (accessed September 25, 2014).
7 Canadian Cancer Society, Canadian Cancer Statistics 2014, May 2014, 38 (accessed September 25, 2014).
8 Organisation for Economic Co-operation and Development, OECD Health Data Statistics 2014.
9 Northwest Territories Health and Social Services, Cancer in the Northwest Territories, 2001–2010: Fact Sheet, 2014
10 Statistics Canada, CANSIM table 105-0541, Fecal Occult Blood Test (FOBT) Obtained in Past 2 Years or, Colonoscopy or Sigmoidoscopy Obtained in Last 5 Years, By Age Group and Sex, Aged 50 or Older, Canada, Provinces, Territories, Health Regions (2007 Boundaries) and Peer Groups (accessed September 25, 2014).
11 Canadian Cancer Society, Canadian Cancer Statistics 2014, May 2014, 12 (accessed September 25, 2014).
12 Statistics Canada, CANSIM table 103-0553, New cases and Age-Standardized Rate for Primary Cancer (Based on the February 2014 CCR Tabulation File), by Cancer Type and Sex, Canada, Provinces, and Territories (accessed September 25, 2014).