
Graduates in Science, Math, Computer Science, and Engineering
Key Messages
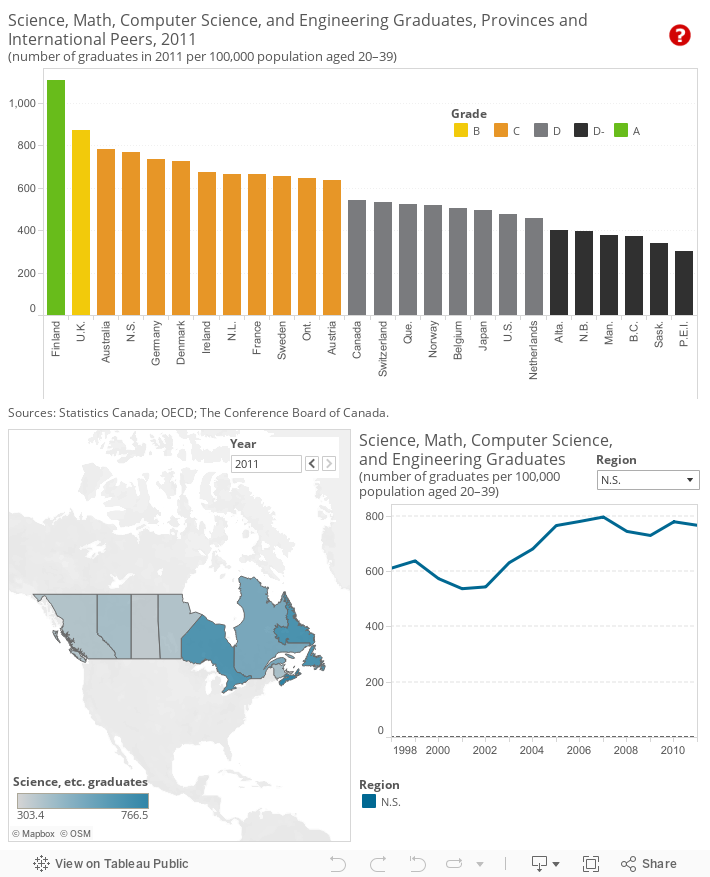
- Nova Scotia is the highest-ranking province on this indicator, coming in fourth; however, because Finland significantly outperforms all other countries, Nova Scotia gets only a “C.”
- Six provinces earn “D–” grades, scoring below last-place international peer the Netherlands.
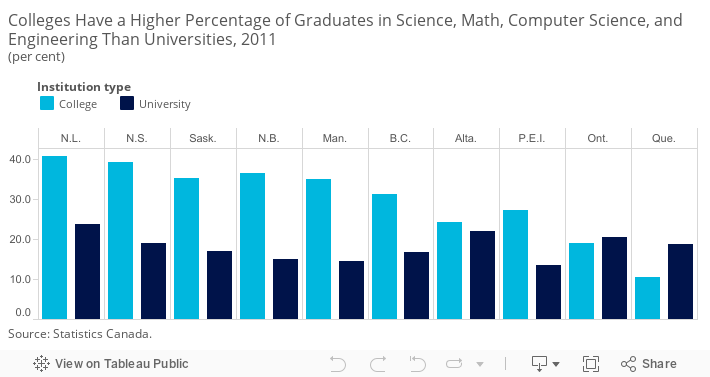
- In 8 out of 10 provinces, a higher percentage of college students than university students are graduating from science, math, computer science, and engineering programs.
Putting science, math, computer science, and engineering graduates in context
The Conference Board has long argued that there is a relationship between the number of science, math, computer science, and engineering graduates and future economic prosperity. These disciplines are widely considered to be the underpinnings of innovation capacity. This is an important point given that Canada has consistently been a “D” performer on innovation. Many of Canada’s peer countries have a strong mathematics and scientific culture that permeates all levels of their education system.
How is this indicator calculated?
To examine how the provinces compare internationally, and with each other, on graduates in science, math, computer science, and engineering, we examined the number of graduates in these fields from undergraduate and advanced research programs in that province or country per 100,000 population aged 20–39. The age range was selected based on the average age at which individuals typically graduate from these types of programs.1 By calculating graduation rates per 100,000 population aged 20–39, we are able to use a common metric to examine the flow of human capital (in the form of science, math, engineering, and computer science graduates) in a country or province.
How do the provinces’ most recent graduation rates in these disciplines compare internationally?
Finland is the clear leader when it comes to graduates in science, math, computer science, and engineering. Finland scores particularly high on engineering graduates, with 15 per cent of all 2011 graduates having an engineering degree (by comparison, 6 per cent of Canadian graduates were in engineering). Given Finland’s high scores on the OECD’s Programme for International Student Assessment (PISA) test, it is not surprising that the country produces so many science graduates. Finland has among the highest scores on science and math for 15 year olds taking the PISA test. The country’s emphasis on R&D and reputation as an innovation leader likely also helps to raise the profile of science, math, computer science, and engineering programs in the eyes of students considering which field of study to enter.
The highest-ranking Canadian province is Nova Scotia, which ranks fourth internationally on this indicator. Six provinces earn “D–” grades, scoring below the last-place Netherlands. For over 30 years, the Netherlands has been trying to increase the number of graduates in science and engineering. In 2012, the government announced that by 2025, 40 per cent of all graduates should have a science and engineering “link.”2 Despite the relatively low number of science graduates to date, there is no evidence of labour market shortages or skills mismatches in the Netherlands.3 However, there is some concern about the “human capital pipeline” and whether there will be enough graduates to meet future demand in that country. Primary concerns for many other countries that also perform poorly on this measure, including Canada and the U.S., are the implications for innovation and the ability to keep up with emerging powers such as India and China, which are producing graduates in these disciplines at an ever-increasing rate.
What if Finland is taken out of the ranking?
Finland illustrates what is possible in terms of graduates in these disciplines. However, it is an outlier, significantly outperforming all other countries. If the peer countries and provinces are ranked without Finland, the U.K. and Australia become “A” performers. Nova Scotia moves up to a “B,” but Canada remains a “D” performer overall.
How do the provinces perform relative to each other?
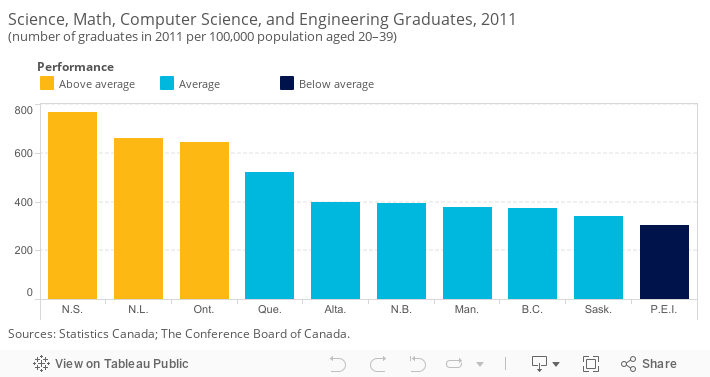
In addition to ranking the provinces against Canada’s international peers, the provinces have been compared with each other and placed into three categories: “above average,” “average,” and “below average.”4
Nova Scotia, Newfoundland and Labrador, and Ontario have the highest per capita numbers of science, math, computer science, and engineering graduates and are considered above average. Nova Scotia, with a population of less than 1 million, has 11 public universities. By comparison, Ontario has a population of over 13.5 million and 20 public universities. Nova Scotia is home to several universities with good international reputations for science and engineering programs that attract students from Nova Scotia and elsewhere.
Increasing the number of graduates in these disciplines will require more students to enrol in, and complete, these programs. Research from the U.S. found that although almost 20 per cent of students started in a science program, only 7 per cent graduated with a science degree.5 Not only are students more likely to switch out of science programs, students in other programs are also less likely to transfer into science programs. Whether it is a lack of preparation or unmet expectations that influence students’ decisions to switch programs, the issue is affecting every province in Canada.
Who is studying science, math, computer science, and engineering?
In Canada, the percentage of the working-age population (25 to 64 years) that has studied science, math, computer science, and engineering technologies varies significantly across demographic factors. Women are under-represented in these disciplines. As revealed in the 2011 National Household Survey, 14 per cent of women had a university degree in these disciplines compared with 35 per cent of men.6 Aboriginal people are also under-represented, with 11 per cent having studied math, science, computer science, or engineering at university versus 24 per cent for the non-Aboriginal population.7 Conversely, immigrants are more likely to have studied one of these disciplines, with 35 per cent of immigrants having majored in one of these disciplines at university compared with 18 per cent of non-immigrants.8 For Canada and the provinces to be competitive, these demographic imbalances need to be addressed.
Do the provinces have relative strengths in any of the disciplines?
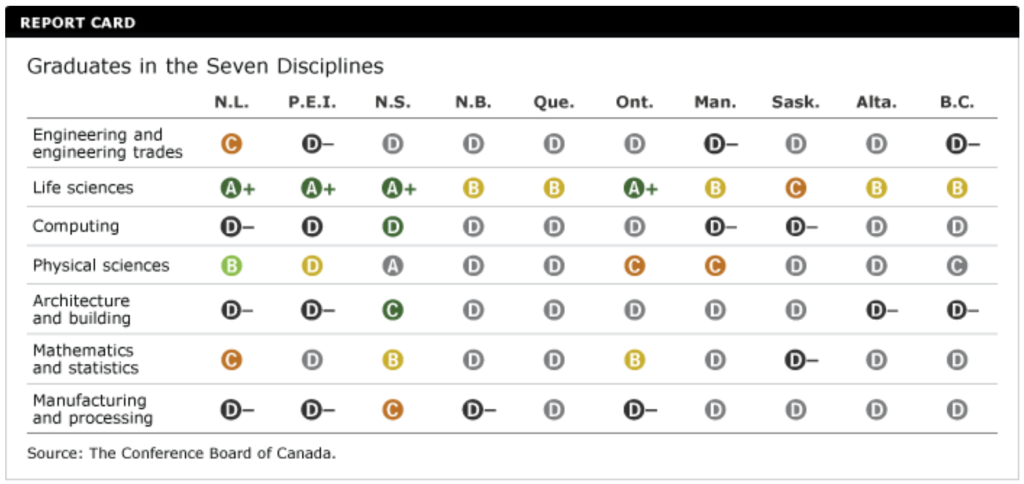
Science, math, computer science, and engineering graduates can be further broken down into seven sub-disciplines:
- engineering and engineering trades
- life sciences
- computing
- physical sciences
- architecture and building
- mathematics and statistics
- manufacturing and processing
When examined separately, the provinces do have some strengths. All provinces perform relatively well in life sciences. Four provinces earn “A+” grades, having more per capita graduates in life sciences than any of Canada’s international peers. Unfortunately, in the other categories, most provinces get “D” or “D–” grades.
Canada needs more graduates in science, math, computer science, and engineering; however, it is not just increasing numbers that will lead to more innovation. Rather, graduates in these fields also need to be supported by appropriate policies and strategies that will see their innovations developed, diffused, and successfully marketed. In analyzing the Innovation report card, the Conference Board concludes that Canada does not take the steps that other countries do to ensure science outputs can be successfully commercialized and used as a source of advantage for innovative companies seeking global market share. Canadian companies are thus rarely at the leading edge of new technology and too often find themselves a generation or more behind the productivity growth achieved by global industry leaders.
Have the provinces improved their relative performance?
Every province has either lost ground or kept the same ranking on the number of graduates in science, math, computer science, and engineering per capita relative to Canada’s international peers. The overall numbers of graduates in each discipline have increased for all the provinces, but they have not kept pace with Canada’s international peers. The leading country, Finland, more than doubled its number of graduates in science, math, computer science, and engineering from 7,294 in 1998 to 14,274 in 2011.
What about the college system?
There is concern that Canada is not producing enough university-level science, math, computer science, and engineering graduates to stimulate innovation and economic growth. But what about the college system? Colleges are increasingly playing a role in business innovation. Many colleges have partnered with businesses to develop and test new products and improve business innovation processes.9
Are colleges producing more science, math, computer science, and engineering graduates? Comparable international data is not available; however, we can compare the percentage of all graduates in science and related disciplines in colleges and universities in the provinces. In 8 out of 10 provinces, colleges produce a higher percentage of science, math, computer science, and engineering graduates than universities. Ontario and Quebec are exceptions, with slightly higher rates of science, math, computer science, and engineering graduates in university than college.
The large discrepancy in the percentage of college and university graduates that is evident in many of the provinces raises some questions. Is there a capacity issue? Is there something about college science programs that is more appealing? College programs are often promoted for their “real world application,” and the evidence suggests that college students are (in most provinces) more likely to be drawn to science and technology programs than university students. More research is needed to understand why.
Footnotes
1 OECD, Education at a Glance 2013 (Paris: OECD, 2013), 61.
2 Pim den Hertog, Cor-Jan Jager, Robbin te Velde, Dag. W. Aksnes, Gunnar Sivertsen, Thed van Leeuwen, and Erik can Wijk, Science, Technology & Innovation Indicators (Utrecht: Ministry of Education, 2012), 110.
3 Ibid., 110.
4 To compare the performance of Canadian provinces relative to one another, we first determined the average score and standard deviation of the provincial values. The standard deviation is a measure of how much variability there is in a set of numbers. If the numbers are normally distributed (i.e., the distribution is not heavily weighted to one side or another and/or does not have significant outliers), about 68 per cent will fall within one standard deviation above or below the average. Any province scoring one standard deviation above the average is “above average.” Provinces scoring less than the average minus one standard deviation are “below average.” The remaining provinces are “average” performers.
5 Ralph Stinebrickner and Todd Stinebrickner, A Major in Science? Initial Beliefs and Final Outcomes for College Major and Dropout, July 2013, 10 (accessed March 6, 2014).
6 Statistics Canada, 2011 NHS: Data Tables, 99-012-X2011046.
7 Ibid.
8 Statistics Canada, 2011 NHS: Data Tables, 99-012-X2011043.
9 Daniel Munro and Joseph Haimowitz, Innovation Catalysts and Accelerators: The Impact of Ontario Colleges’ Applied Research (Ottawa: The Conference Board of Canada, 2010), 2.