
Students With Inadequate Reading Skills
Key Messages
- Only three of ten Canadian provinces earn either “A” or “A+” grades for having low proportions of students with inadequate reading skills.
- British Columbia earns an “A+” grade, scoring higher than all other provinces and all of Canada’s peer countries.
- The proportion of students with inadequate reading skills increased significantly in all but two provinces between 2000 and 2012, putting many students at greater risk of leaving school and doing poorly in the labour market.
Putting student reading skills in context
The Programme for International Student Assessment (PISA) is an international assessment of the skills and knowledge of 15 year olds, coordinated by the Organisation for Economic Co-operation and Development (OECD). It assesses whether students approaching the end of compulsory education have acquired the skills that are essential for full participation in modern society, particularly in mathematics, reading, and science.1 There have been five comparable PISA assessments of reading skills—in 2000, 2003, 2006, 2009, and 2012.
PISA defines reading literacy as “an individual’s capacity to understand, use, reflect on, and engage with written texts, in order to achieve one’s goals, develop one’s knowledge and potential, and participate in society.2
What kind of reading skills does PISA test?
The reading skills that PISA measures are much broader than the basic ability to read, spell, and recognize words. Reading literacy focuses on the ability of students to use written information in real-life situations.3 Working with the view that reading is an activity that supports other purposes, “PISA focuses on measuring the extent to which individuals are able to construct, expand and reflect on the meaning of what they have read in a wide range of texts common both within and beyond school.”4
Reading, as defined here, is understood as a skill that can be used or applied to make sense of various written materials and, in turn, can assist in other practical activities.
What are inadequate reading skills?
PISA reading skills are measured on a continuum, with level 6 the highest and level 1b the lowest. There is no cut-off at which a person is said to either have or not have reading skills. However, students at level 2 are capable of completing only the basic reading tasks developed for PISA. Indeed, level 2 is described as “a baseline level of proficiency at which students begin to demonstrate the reading literacy competencies that will enable them to participate effectively and productively in life.”5 Scores at level 2 and below mean that students have not acquired the level of reading skills required to participate effectively and productively in life.
How do the provinces rank relative to Canada’s international peers?
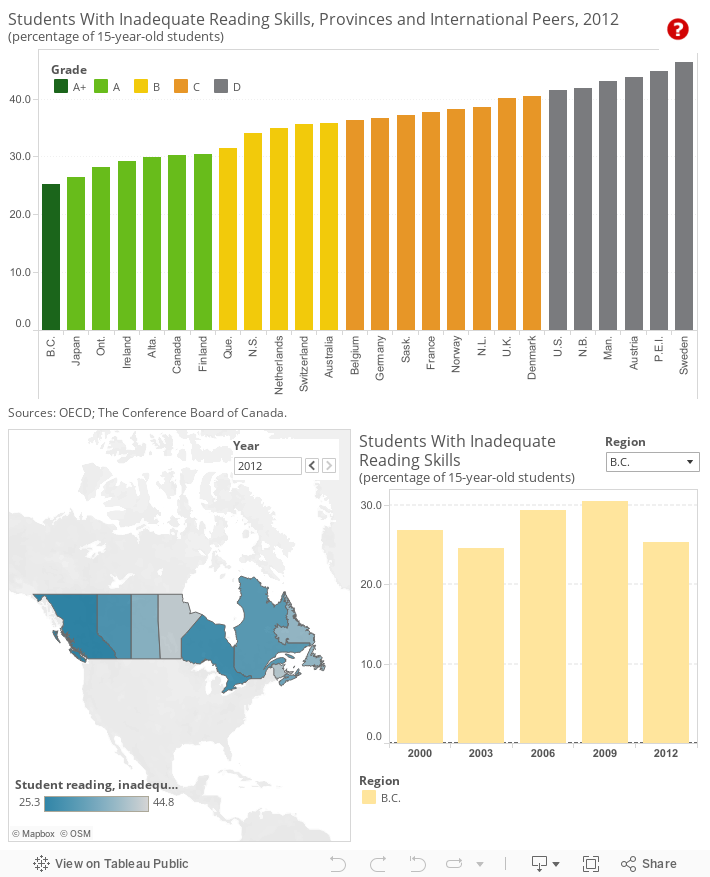
Taken as a whole, Canada compares very favourably to international peers. With 30 per cent of Canadian 15 year olds scoring at level 2 or below on PISA’s reading test, Canada performs worse than only Japan and Ireland among international peers. Viewed at a provincial level, however, there is significant variation across the country.
With only 25.3 per cent of its students showing inadequate reading skills, British Columbia leads all provincial and international jurisdictions, earning it an “A+” grade.6 Ontario and Alberta compare favourably to other provinces and international peers. Ontario’s proportion of students with inadequate reading skills (28.1 per cent) and Alberta’s (29.9 per cent) are lower than the Canadian average (30.3 per cent), and earn those provinces grades of “A” relative to international peer countries. Quebec also fares reasonably well, with an only marginally higher proportion (31.5 per cent) of students with inadequate reading skills than the Canadian average, earning the province a “B” in the international comparator group.
By contrast, nearly 42 per cent of students in New Brunswick, 43 per cent in Manitoba, and nearly 45 per cent of students in P.E.I. have inadequate reading skills, earning all three provinces grades of “D” relative to international peers. Internationally, these scores put those provinces in the company of the U.S. (41.5 per cent), Austria (43.7 per cent), and Sweden (46.3)—all of which earn “D” grades.
How do the provinces perform relative to each other?
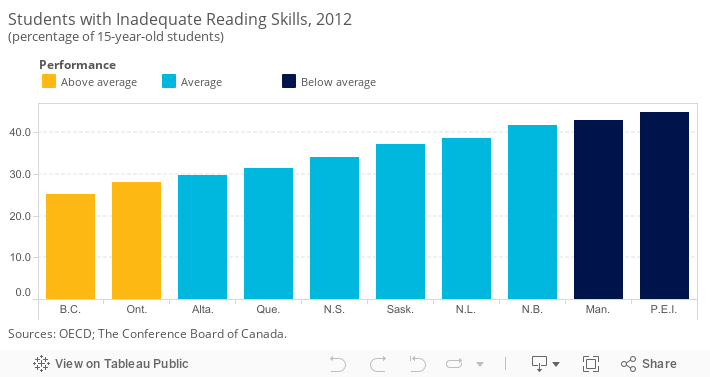
In addition to ranking the provinces against Canada’s international peers, the provinces have been compared with each other and placed into three categories: “above average,” “average,” and “below average.” 7
There is significant variation across the country. British Columbia and Ontario are above-average performers, while P.E.I. and Manitoba are below-average performers. The remaining six provinces are average performers.
How have provincial inadequate reading skills changed over time?
Between 2000 and 2012, the proportion of Canadian students with inadequate reading scores has increased in all provinces except two. In British Columbia, the percentage of students with inadequate skills peaked at nearly 31 per cent in 2009, but by 2012 the share had fallen to almost the lowest level seen in that province over the past decade. Although its results have varied from year to year, Ontario in 2012 was at the same level it was in 2000. But with declining performance in all other provinces and many international peers, Ontario’s relative grade rose from a “B” to an “A.”
The worst changes occurred in Manitoba—where the proportion of students with inadequate reading skills climbed from 29 per cent in 2000 to over 43 per cent in 2012—and Prince Edward Island—which saw an increase from 34.7 to nearly 45 per cent. Although Saskatchewan has managed to hold on to a grade of “C” over the past four tests, that province has seen its share of students with inadequate reading skills increase by nearly 9 percentage points since 2000 to 37.2 per cent in 2012. Part of the explanation for Manitoba and Saskatchewan’s lower performance may be due to the high proportions of Aboriginal students in those provinces (16.7 and 15.6 per cent, respectively) relative to the Canadian average (4.3 per cent). The PISA test, however, was not administered in First Nations schools, so only Aboriginal students in non-First Nations schools would have been tested.
Do PISA reading performance results predict future educational success?
Reducing the share of students who perform poorly in reading is important for both the students and society as a whole, since there are large economic and social costs associated with poor performance in school.8 The OECD reports that “levels of reading literacy are more reliable predictors of economic and social well-being than is the quantity of education as measured by years at school or in post-school education.”9
Previous studies based on PISA data have shown a link between reading skills at age 15 and outcomes in later life. For example, results from Statistics Canada’s Youth in Transition Survey show a strong association between reading proficiency and educational attainment: Canadian students in the bottom quartile of PISA reading scores were much more likely to drop out of high school and less likely to have completed a year of post-secondary education than those in the highest quartile of reading scores. The study also found that reading scores of 15-year-old students were an important predictor of earnings.10
Footnotes
1 OECD, PISA 2012 Assessment and Analytical Framework: Mathematics, Reading, Science, Problem Solving, and Financial Literacy (Paris: OECD, 2013), 25.
2 Ibid., 28.
3 Ibid., 176.
4 OECD, Learning for Tomorrow’s World: First Results From PISA 2003 (Paris: OECD, 2004), 279.
5 Ibid., 195.
6 No data were collected in the three territories and in First Nations schools.
7 To compare the performance of Canadian provinces relative to one another, we first determined the average score and standard deviation of the provincial values. The standard deviation is a measure of how much variability there is in a set of numbers. If the numbers are normally distributed (i.e., the distribution is not heavily weighted to one side or another and/or does not have significant outliers), about 68 per cent will fall within one standard deviation above or below the average. Any province scoring one standard deviation above the average is “above average.” Provinces scoring less than the average minus one standard deviation are “below average.” The remaining provinces are “average” performers.
8 OECD, PISA 2009 Results: Learning Trends. Volume 5: Changes in Student Performance Since 2000 (Paris: OECD, 2010), 42.
9 OECD, PISA 2009 Results: What Students Know and Can Do—Student Performance in Reading, Mathematics, and Science, Volume 1 (Paris: OECD, 2010), 32.
10 Pierre Brochu, Marie-Anne Deussing, Koffi Houme, and Maria Chuy, Measuring Up: Canadian Results of the OECD PISA Study (Toronto: Council of Ministers of Education, Canada, 2013), 10.