
Patents
Key Messages
- Five provinces earn D– grades, ranking at the bottom of the pack on patents.
- Ontario is the top-ranked province but gets only a D and is outperformed by 12 of the 16 international peers.
- Between 1998 and 2013, every province had a significant increase in the number of patents per million population, yet relative to international peers, the provinces remain consistent D and D– performers.
Why are patents important to innovation?
Patents are a way for firms to protect intellectual property and capture value from their innovations. Because government-granted rights give inventors a monopoly to make, sell, and use their inventions, patents provide businesses with some confidence that they can invest in creating and developing ideas without having them copied by competitors for a certain duration. As the Council of Canadian Academies’ Expert Panel on the State of Industrial R&D in Canada notes, a patent can be a useful measure of innovation insofar as “an idea that is patented must be valuable or time and money would not have been expended in patenting it” and because it meets a “test of novelty or it would not have passed the scrutiny of examiners at the patent office.”1
To be sure, not all patents are equally valuable. Some have greater commercial value than others, which means that simple counts of patents will miss important qualitative differences. Also, not all valuable ideas and inventions will be patented. Some firms involved in food product innovation, for example, tend not to patent their innovations because they find it easy enough to simply keep their recipes and processes secret.2 Additionally, some firms will forgo patenting if they think the costs of defending those patents against challenges and misuse by others might be greater than losses incurred by not patenting. Clearly, patent counts will miss some kinds of innovation.
Still, patents provide a useful measure of some of the innovative activity in an economy—particularly progress made toward the development and commercialization of new products and processes. They serve as an output indicator (albeit a partial and imperfect indicator) of R&D activity and its productivity, as well as of the state of development of particular technologies and industries.3 They can also incent firms to conduct more research and development—another key element of innovation—as they lower investment risk by providing greater confidence in the ability to capture returns.4
Finally, patents “are also a means of sharing cutting-edge information. Because each patent document describes a new aspect of a technology in clear and specific terms and is available for anyone to read, they are vital resources for businesses, researchers, academics, and others who need to keep up with developments in their field.”5 In this way, patenting supports and encourages further research and innovation.
How is patent performance measured?
Patents per population are measured as the number of patents filed under the Patent Cooperation Treaty (PCT) per million population. Although this captures only a fraction of the patents filed by firms across jurisdictions, using PCT patents has two key advantages.
First, because these patents must be filed outside the inventors’ own jurisdiction, using them eliminates “home bias” in the data—i.e., the tendency of firms to patent most with the patent offices in their own country.6 If we used data from the U.S. Patent and Trademark Office, for example, the U.S. would have inflated numbers relative to international peers because U.S. firms are more likely to patent via the U.S. Patent and Trademark Office than non-U.S. firms.7
Second, because the OECD PCT patents database collects patent data at the regional level, it allows for direct comparisons between the provinces and the international peer countries.
How do the provinces rank relative to international peers?
The provinces are very poor performers on the patents indicator relative to international peers. Five provinces earn D grades, and five earn D– grades for ranking below all the international peers.
With 106 patents per million population in 2013, Ontario is the top-ranking province but places below 12 of the 16 peer countries and gets a D. The top three countries—Japan (328 per million population), Sweden (313), and Switzerland (295)—patent at roughly three times the rate of Ontario and three-and-a-half times the rate of Canada as a whole.
B.C. (98) also scores a D and manages to outrank three international peers—U.K. (97), Ireland (83), and Australia (77)—as well as the Canadian average (90). Alberta (95) earns a D and outranks these same countries, except the United Kingdom. P.E.I. (83) and Quebec (78) are the other D performers, but they manage to outrank only Australia among international peers.
The remaining five provinces earn D– grades and take up the bottom positions in the international ranking. The weakest performers—New Brunswick (28) and Newfoundland and Labrador (21)—patent at rates that are 12 and 15 times less intensive than Japan’s rate, respectively, and three and four times less intensive than Canada’s as a whole.
With 90 patents per million population, Canada scores a D and ranks 14th among the 16 peer countries—a marginal improvement over its 15th-place ranking in the previous report card.
How do the provinces rank relative to each other?
Ontario is the highest-ranking province, followed by B.C., Alberta, P.E.I., and Quebec. All five provinces score D grades. Ontario, B.C., and Alberta find themselves above the Canadian average, while P.E.I. and Quebec are below the Canadian average. Quebec has fallen from 17th to 20th position since the previous report card, while P.E.I. has climbed from 22nd to 19th and improved from a D– to a D grade.
The remaining five provinces have patenting rates significantly below the Canadian average and earn D– grades. Given that Canada’s top-performing province, Ontario, achieves only a D grade relative to international peers, there is substantial room for improvement by all provinces.
How has provincial performance on patents changed over time?
Between 1998 and 2013, the number of patents per million population improved significantly in every province. Ontario led the provinces, more than doubling its patents per million from 52 in 1998 to 106 in 2013.
Looking at the more recent period from 2008 to 2013, the provinces with the largest increases in patents per million were Saskatchewan (72 per cent), Newfoundland and Labrador (68 per cent), and P.E.I. (60 per cent). By contrast, patenting rates declined in Quebec (–8 per cent), Nova Scotia (–6 per cent), and New Brunswick (–5 per cent). As a whole, Canada increased its patents per million population from just under 79 in 2008 to just over 90 in 2013—or roughly 15 per cent growth over the past five years.
During those same five years, eight international peers saw their patenting rates decline, while seven saw them increase. The greatest increases were in Japan (49 per cent), the U.S. (23 per cent), and Austria (21 per cent). The largest declines were seen by Ireland (–13 per cent), Australia (–11 per cent), and Denmark (–7 per cent). All the peers maintained the same grades they received in the previous report card, with only minor changes in the relative rankings.
With many of the international peers having grown at a strong rate over the past 20 years, and given the fact that Canada and the provinces started at the far back of the class, only P.E.I. was able to improve its grade between 1998 and 2013 from a D– to a D. All other provinces receive the same grades for 2013 data as they did for 1998—D for Quebec, Ontario, Alberta, and B.C., and D– for Newfoundland and Labrador, New Brunswick, Nova Scotia, Manitoba, and Saskatchewan.
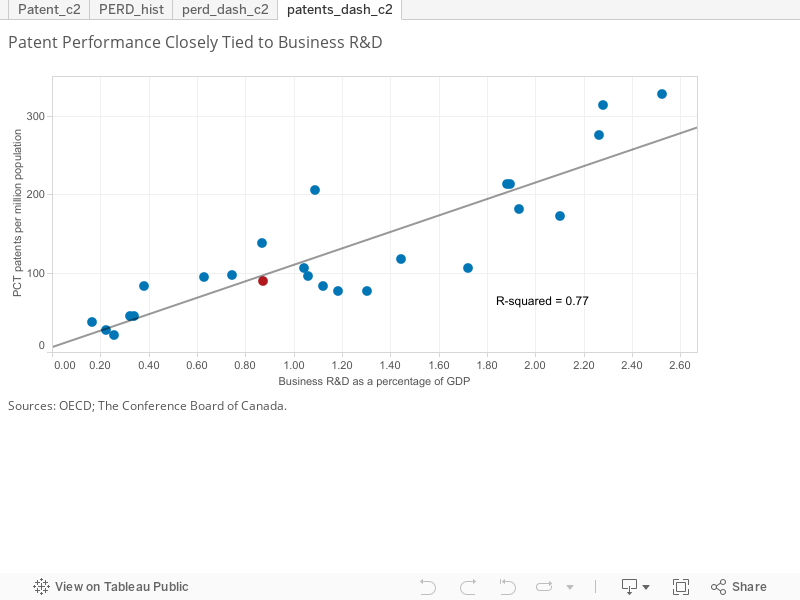
Why do provinces lag on patents?
Canada and the provinces lag international peers on patents for a few reasons. First, across the OECD, there is a very strong relationship between business enterprise R&D and patenting. Countries and provinces with higher business R&D as a percentage of GDP—and thus whose firms are generating and developing new ideas and innovations—have higher patent rates.8 Simply put, patenting rarely occurs without firms conducting research that would warrant patentable results. For example, the top three peers on business R&D—Japan, Switzerland, and Sweden—are also the top countries on patents, while the weakest regions on business R&D—Nova Scotia, New Brunswick, Saskatchewan, and Newfoundland and Labrador—are also at or near the bottom of the patents rankings. P.E.I. performs slightly better on patents than its business R&D would predict.
Canada and the larger provinces are middling performers when it comes to converting R&D spending into patents. Canada produces 0.25 patents per million dollars of spending on business R&D—the same rate as the average of its international peers. Among the larger provinces, B.C. (0.35) and Ontario (0.27) produce slightly more patents per million dollars of business R&D than the Canadian average, while Alberta (0.24) and Quebec (0.18) produce fewer per million dollars of business R&D than the Canadian average. By contrast, the Netherlands produces 0.43 and Japan produces 0.36.
Using triadic patents (patents filed at the U.S., European Union, and Japanese patent offices for the same invention) rather than PCT patents to make the same calculation, the Expert Panel on the State of Industrial R&D in Canada found that Canada ranks last among the 18 countries it examined.9
Two smaller provinces—Nova Scotia (0.75) and P.E.I. (0.74)—show exceptionally strong ratios for converting business R&D to patents. But as a general rule in Canada as a whole and across most provinces, firms’ record of moving from R&D spending to patents needs improvement. This reality fits with the often-stated claim that while Canada is strong at producing good ideas, commercialization capacity and performance is particularly weak. Moreover, so long as Canada’s business R&D spending continues to lag international peers, even a middling business R&D-to-patent conversion rate is not enough to keep the country competitive.
How can the provinces improve?
Although the provinces have seen growth in patents per population, they have not been able to close the large gap with international peers. To do so, businesses need to increase their R&D spending and activity to get more ideas and potential innovations (and thus patents) in the pipeline.
At the same time, Canada’s persistently low ratio of patents to business R&D confirms that Canadian business capacity to commercialize research continues to lag. As with other areas of innovation performance, Canadian businesses appear to suffer from deficits of management and legal expertise. Too few firms have the management expertise needed to select promising research and innovation projects, make good decisions about resource allocation, attract funding, and shepherd projects from idea to innovation and, ultimately, commercialization.10 Improving managers’ education and skills, and drawing on external management expertise, can help.
Some firms may also need better legal expertise to help them successfully navigate the process of acquiring and protecting their intellectual property, including patents. Given that this may be especially challenging and costly for smaller firms, policy-makers may want to consider providing legal workshops and clinics, as well as supporting pro bono legal advice for innovating small and medium-sized businesses.11
Footnotes
1 Expert Panel on the State of Industrial R&D in Canada, The State of Industrial R&D in Canada (Ottawa: Council of Canadian Academies, 2013), 51. Emphasis added.
2 Daniel Munro, James Stuckey, and Erin Butler, Competing for the Bronze: Innovation Performance in the Canadian Food Industry (Ottawa: The Conference Board of Canada, 2012).
3 OECD, Patents by Regions: Key Statistical Concept.
4 Canadian Intellectual Property Office, A Guide to Patents: Part I.
5 Ibid.
6 Expert Panel on the State of Industrial R&D in Canada, The State of Industrial R&D in Canada, 52.
7 Using triadic patents, rather than PCT patents, would also address this concern about home bias, but up-to-date triadic patent data are not available for all firms.
8 Expert Panel on the State of Industrial R&D in Canada, The State of Industrial R&D in Canada, 51.
9 Ibid., 54.
10 Daniel Munro and Jessica Edge, Improving Innovation Management Decision-Making: Thinking Like an Innovator (Ottawa: The Conference Board of Canada, 2014), 20–21; Daniel Munro, Navigating and Managing Technology-Driven Change (Ottawa: The Conference Board of Canada, 2015).
11 Myra Tawfik and James Hinton, “To Support Canadian Startups, Offer Pro Bono Legal Clinics,” The Globe and Mail, June 17, 2015.