
Water Withdrawals
Key Messages
- Manitoba, Nova Scotia, P.E.I., Ontario, and Saskatchewan all score “A” grades on water withdrawals and rank in the top 14 among all 25 jurisdictions.
- Newfoundland and Labrador gets a “D” grade, the worst score among all provinces, and has the second highest per capita water withdrawals among all jurisdictions—only the U.S. does worse.
- Canada as a whole scores a “B” and ranks 10th among 15 peer countries.
Putting water withdrawals in context
The fresh water we use for drinking, agriculture, and industry comes from a variety of sources, including lakes, rivers, and groundwater. All the fresh water we consume eventually makes its way back into the hydrologic cycle, and hence back into a lake, a river, the groundwater, or an ocean. But water is frequently not returned to the source it was drawn from. This means it is possible to over-consume water in an area, to the point where local fresh water will no longer be sufficiently available. Additionally, water returned to the hydrologic cycle after human use is often of reduced quality.1
Ensuring access to clean fresh water is critical for all countries, as fresh water is a necessary component of most ecosystems and human economic activity. Therefore, it is important to monitor and limit our water withdrawals, to ensure adequate local water supplies and to limit our negative impact on water quality. Here, we compare water withdrawals per capita but exclude water withdrawn to cool thermal-powered electricity plants (such as coal plants and nuclear plants), as these facilities typically return the water they withdraw to the local watershed, albeit at a warmer temperature.
How do the provinces rank relative to Canada’s international peers?
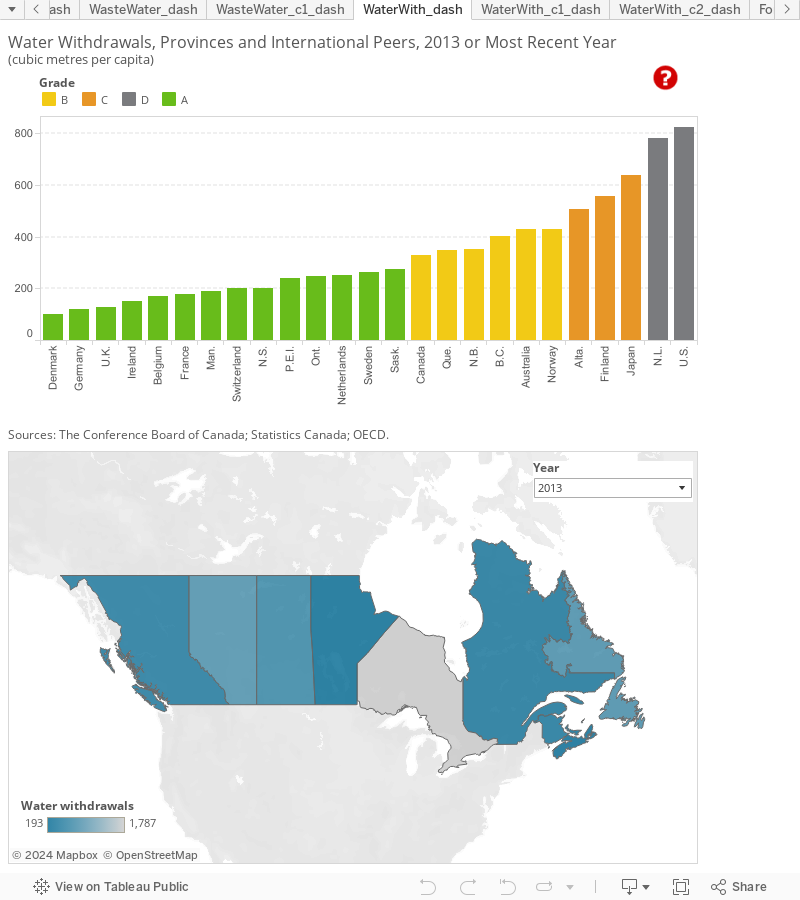
Per capita water withdrawal varies widely across provinces. Manitoba is the top-ranked province, with water withdrawals of 191 cubic metres per capita per year. Four other provinces also perform well on an international scale and score “A” grades: Nova Scotia (202), P.E.I. (238), Ontario (249), and Saskatchewan (276) all withdrew roughly 200 to 300 m3 of water per capita in 2013. These rates are comparable to those in France (177) and Switzerland (200) on the low end and to Sweden (262) on the higher end. Denmark is top-ranked overall, with water withdrawals of less than 100 m3 per capita.
Quebec (348), New Brunswick (351), and British Columbia (404) all have water withdrawals closer to mid-range international withdrawal rates (350–400 m3) and score “B” grades. These withdrawal rates are comparable to those of Australia (428) and Norway (430).
Canada (330) as a whole similarly scores a “B,” ranking 10th among the 15 peer countries.2 The country’s overall grade is pulled down by Alberta (508; the only “C” province) and Newfoundland and Labrador (782), which has the highest share of water withdrawals among the provinces, giving it a “D” grade. At over 780 m3 per capita, Newfoundland and Labrador withdraws more water than Finland (556) and Japan (639) but less than the U.S. (825), the worst-ranked peer country.
How do the provinces perform relative to each other?
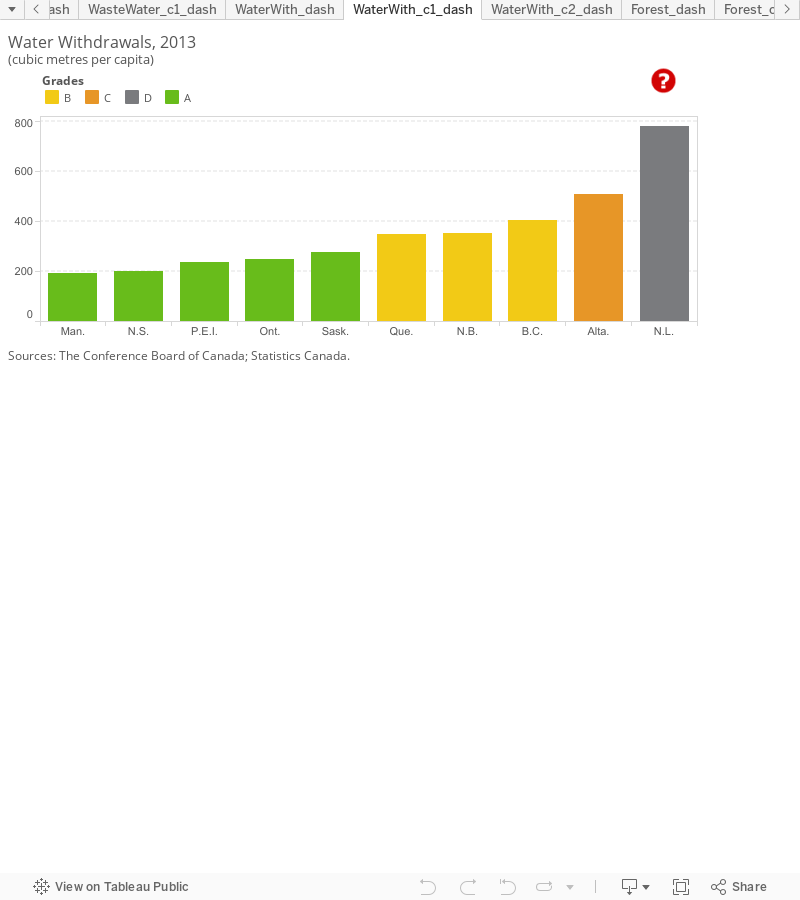
Manitoba (191), Nova Scotia (202), and P.E.I. (238) have the lowest shares of water withdrawals among all the provinces. Ontario and Saskatchewan are also “A” performers, with withdrawals of around 250–275 m3 per capita. Quebec, New Brunswick, and British Columbia, which all score “B” grades, have water withdrawal rates ranging roughly between 350 and 400 m3 per capita. Alberta gets the only “C” grade, for withdrawals of 508 m3 per capita. At 782 m3 per capita, Newfoundland and Labrador’s water withdrawals are substantially greater than all other provinces. Newfoundland and Labrador’s water withdrawal rate is four times higher than that of Manitoba, the top-ranking province, and over 50 per cent higher than Alberta, the second-worst performing province.
How do the territories fare on water withdrawals?
Canada’s territories all have relatively low water withdrawal rates. Nunavut outperforms all provinces, including top-ranked Manitoba, with 159 m3 of water withdrawals per capita, earning it an “A” grade. Yukon’s withdrawal rate is about double that of Nunavut, at around 319 m3, making Yukon a “B” performer. The Northwest Territories have a withdrawal rate in between those of B.C. and Alberta, at 451 m3 per capita, and similarly earn a “B” grade.
The territories are not included in the overall provincial and international benchmarking calculations because data for each individual territory were not available for several of the indicators included in the overall environment report card. The Conference Board is, however, committed to including the territories in our analysis, and so we provide information on territorial performance when data are available.
How is water used in Canada and the provinces?
Water withdrawal statistics recorded by Statistics Canada are broken down into three main categories: residential water withdrawals, water used for irrigation, and industrial water withdrawals. Thus, the differences in water withdrawals between provinces reflect not only behavioural differences between individuals and the different climates, but also the different structure of each region’s economy, as well as the size and composition of their industries.
The report card excludes water withdrawn to cool thermal-powered electricity-generation plants, given that nuclear power plants typically return the water they withdraw to the local watershed, albeit at a warmer temperature. As a result, the industrial water withdrawals reported here are much lower than they would be if the cooling withdrawals were included, particularly for Ontario, which generates more than half its electricity from nuclear facilities.
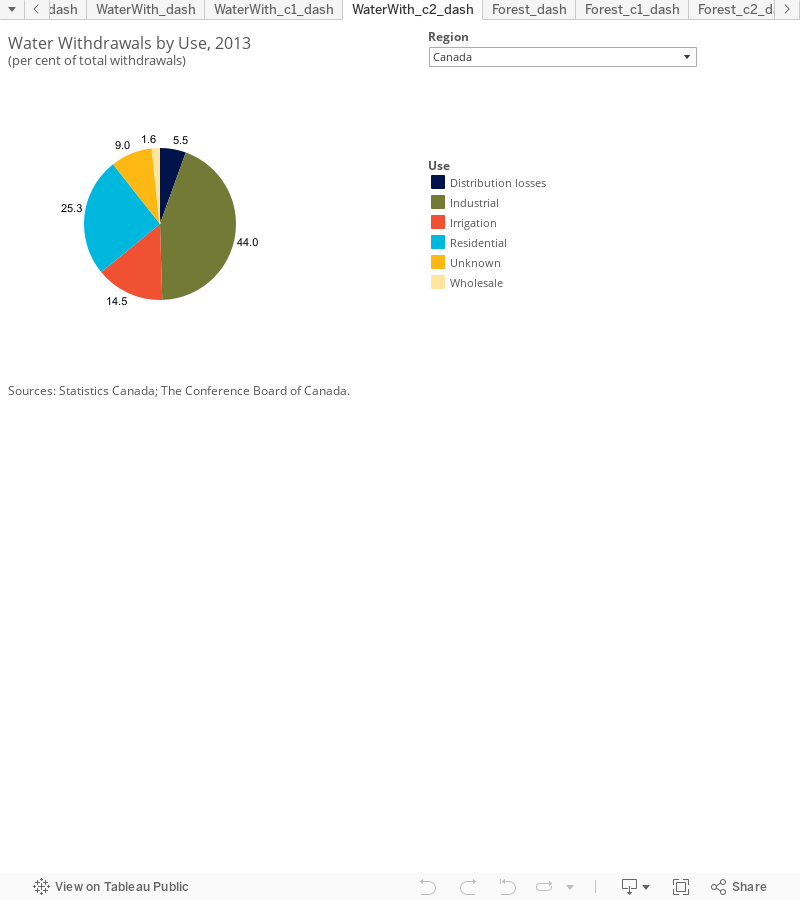
Nationally, residential water use accounts for one-quarter of freshwater withdrawals, but this varies somewhat between provinces and territories. In Alberta, for instance, residential consumption accounts for only 12 per cent of water withdrawals, but in Yukon, residential consumption is responsible for over 50 per cent of total freshwater withdrawals.
Irrigation requires a relatively small proportion of total water withdrawals within most provinces; about 15 per cent of water is withdrawn by for irrigation nationwide. However, as with residential withdrawals, this varies widely across the country. Irrigation withdraws less than 1 per cent of water in several provinces (Newfoundland and Labrador, Quebec, Ontario, Nova Scotia, and New Brunswick) and all three territories, but accounts for 20 per cent of freshwater withdrawals in Manitoba and over 60 per cent in Alberta.
Industry is the biggest consumer of fresh water, with withdrawals that amount to 44 per cent of the national total. Water is used to cool industrial equipment, clean manufactured goods, and act as a solvent. Regionally, industrial water consumption counts for as little as 18 per cent of total withdrawals in Alberta and over 60 per cent in the Northwest Territories and Nunavut.
Other sources of water withdrawals include the water distribution system itself (as water is lost through leaks or used to flush out the system) and water provided wholesale to other jurisdictions. Finally, the end use of roughly 9 per cent of water withdrawals is unknown.
Why does Newfoundland and Labrador withdraw so much water?
Newfoundland and Labrador withdraws more fresh water, per capita, than any other province, by a wide margin. This is driven by high residential withdrawals (229 m3 per capita, over twice the national average of 83 m3) and high industrial withdrawals (358 m3 vs. the national average of 111 m3). It is not fully clear why Newfoundland and Labrador has such high residential water withdrawals, but a high proportion of municipalities in the province charge flat fees for their water instead of volumetric rates,3 something that disincentivizes water-saving behaviours (see section below). The high industrial water use is mostly due to the mining industry, which withdraws roughly 40 per cent of the province’s fresh water.4
It is difficult to say what accounts for the rest of Newfoundland and Labrador’s water withdrawals. Over 20 per cent of the province’s total withdrawals are distributed municipally, but with unknown end use.
How can we reduce water consumption in Canada?
Canadians must embrace water conservation measures. More than 15 years ago, Environment Canada first warned that without substantially increasing the price of water consumption, delivery infrastructure was at risk of deteriorating beyond usability.
Several studies show that water revenues are not sufficient to cover operations, repairs, upgrades, and expansion, and cover only a small part of the costs of supplying water. For example, irrigation water charges recover only about 10 per cent of the development cost of the resource. Household water charges similarly do not cover all the cost.5
Increasing the cost of water is one of the best incentives for conservation. Canadians subject to water metering and volume-based (or volumetric) water pricing use less water than their rural counterparts who have no means of accounting for their water usage or any direct incentive to use it wisely.6 In Europe, where the price of water has increased, water withdrawals have simultaneously decreased.
Fortunately, Canada seems to be moving in the right direction. Between 2006 and 2009, the proportion of the population receiving metered water residentially increased from 63 to 72 per cent, and the proportion of commercial operations receiving metered water increased from 80 to 87 per cent.7 The growth in metering increases the ability of provinces to apply volumetric water rates, which should in turn help to reduce consumption.
Looking at individual provinces, Quebec, B.C., and P.E.I. charge volumetric rates that are well below the Canadian average. Newfoundland and Labrador doesn’t have enough municipalities that use volumetric rates to estimate the average cost. This suggests that Newfoundland and Labrador, Quebec, B.C., and P.E.I. could decrease municipal residential water consumption, either by increasing their volumetric water rates or by implementing volumetric metering more broadly (where possible).
Footnotes
1 Environment and Climate Change Canada, Introduction to Water Use (accessed March 22, 2016).
2 Note: Only 15 peer countries were included in this comparison. The most recent available data for water withdrawals from Austria are from 1995, and so was judged too old to compare with the other peer countries.
3 The proportion of the population receiving volumetric water pricing is unclear. In the most recent available document on municipal water pricing (from 2011), Environment Canada notes that too few municipalities from Newfoundland and Labrador use volumetric water pricing to establish an average price for metered water in the province. This was the only province for which an average was not presented, suggesting that Newfoundland and Labrador has a larger proportion of its population on flat (un-metered) water rates than any other province.
4 Statistics Canada does not present data for water withdrawals by the mining industry in Newfoundland and Labrador; the data are available only for the Atlantic provinces in aggregate. We have estimated the water withdrawals of the mining industry in Newfoundland and Labrador by disaggregating the Atlantic water withdrawals, based on the relative sizes of the mining industries in each Atlantic province (using output as a measure of industry size).
5 Environment Canada, Wise Water Use (accessed July 7, 2015).
6 See, for example, Environment Canada, 2011 Municipal Water Pricing Report (Ottawa: Environment and Climate Change Canada, 2011), 10.
7 Ibid., 3.