
Nitrogen Oxides Emissions
Key Messages
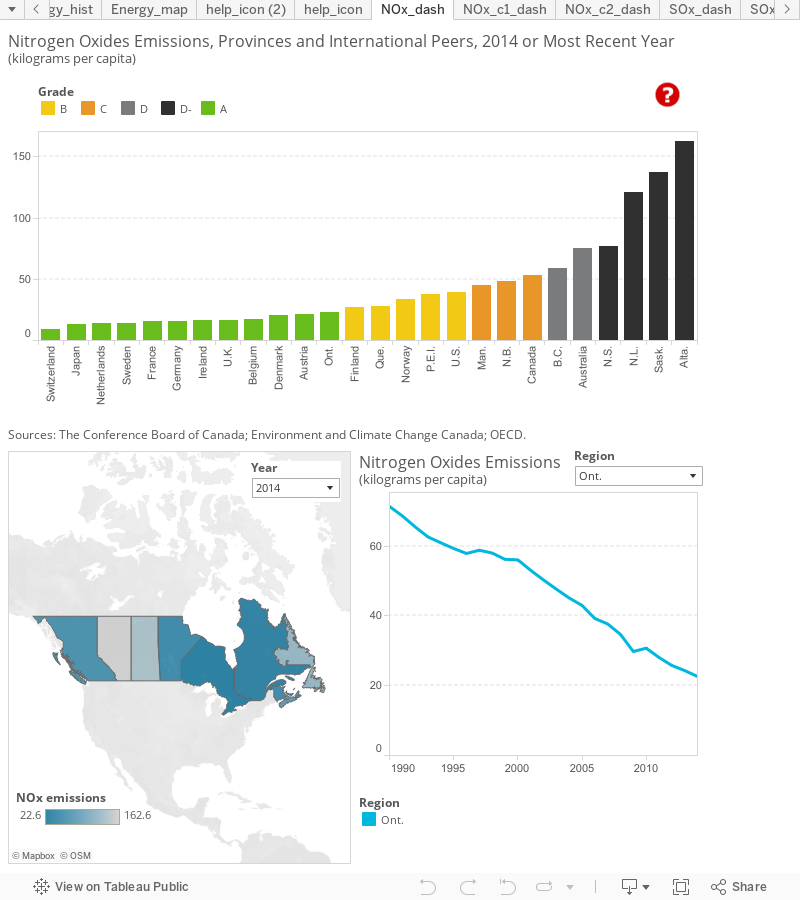
- Ontario has the lowest NOx emissions per capita among the provinces and scores an “A,” ranking 12th among the 26 comparator regions.
- Alberta, Saskatchewan, Newfoundland and Labrador, and Nova Scotia all score “D–” grades for ranking below the bottom-ranked peer country, Australia.
- Overall, Canada gets a “C” and ranks ahead of only Australia among the peer countries.
Putting nitrogen oxides emissions in context
Nitrogen oxides (NOx) contribute to smog and acid rain and are hazardous to human health and the environment. NOx are released during the combustion of fossil fuels, mainly by vehicles, electricity generation, and manufacturing processes.1 NOx are primarily a traffic-related pollutant, and emissions are highest in urban areas. They can block the transmission of light, reducing visibility in urban areas. On a larger scale, nitrogen oxides can originate in one place and be transported long distances by prevailing winds, contributing to poor air quality and acid rain in other regions.
How do nitrogen dioxide and smog affect the quality of life of Canadians?
Nitrogen dioxide can irritate the lungs and lower resistance to respiratory infection. People with respiratory problems such as asthma and bronchitis, as well as children and the elderly, are particularly at risk.
NO2 chemically transforms into nitric acid, which, when deposited as acid rain, contributes to lake acidification and harms aquatic ecosystems. It can also damage trees and crops, resulting in substantial environmental losses.
When NO2 undergoes a chemical transformation in the atmosphere, it becomes a component of ground-level ozone and smog. Exposure to smog impairs lung function in the short term and accelerates deterioration in lung function over the long term.
How do the provinces rank relative to Canada’s international peers?
Ontario is the only “A” performer among the provinces. The province’s emission rate of 22.6 kg per capita is comparable to rates in Denmark (20.6) and Austria (21.2) but much higher than those of the other 11 peer countries that also receive “A” grades.
Quebec (27.6) and P.E.I. (37.7) score “B” grades, putting them in the company of Finland (26.9), Norway (33.1), and the U.S. (39.1).
Manitoba (45.3) and New Brunswick (47.8), as well as Canada as a whole (53.3), are the only jurisdictions to score “C” grades. Canada ranks second to last among international peers—the only peer country with higher NOx emissions per capita is Australia (75.2), which gets a “D.” British Columbia also gets a “D” for NOx emissions of 58.6 kg per capita.
Nova Scotia (76.7), Newfoundland and Labrador (120.8), Saskatchewan (137.3), and Alberta (162.6) rank at the bottom of the pack and receive “D–” grades for the highest emission rates among all the jurisdictions. Alberta and Saskatchewan are the worst ranked overall and have NOx emission rates over two times the rate of Australia.
How do the provinces perform relative to each other?
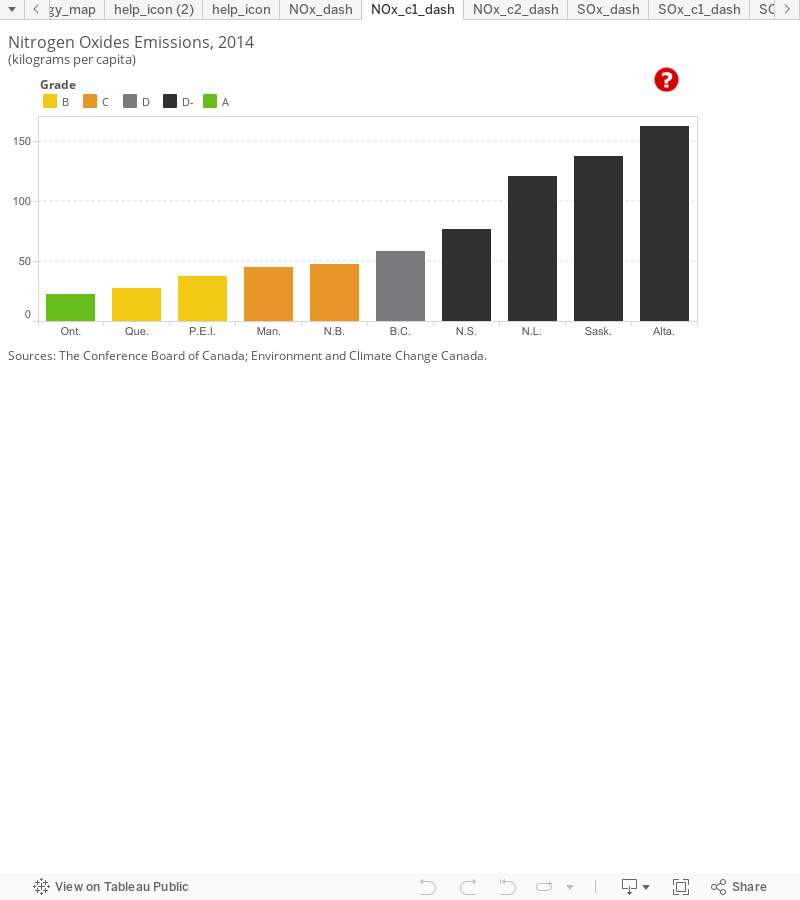
Ontario and Quebec rank highest among the provinces. They score an “A” and “B” respectively and have NOx emission rates below 30 kg per capita. P.E.I. is not far behind, with a “B” grade and an emission rate close to 40 kg per capita.
Manitoba, New Brunswick, and B.C. fall in the middle of the provincial distribution, with the two former provinces earning “C” grades and the latter earning a “D.” These provinces emit roughly 45 to 60 kg of NOx per capita, twice as much as Ontario and Quebec.
Ranking lowest among the provinces are Nova Scotia, Newfoundland and Labrador, Saskatchewan, and Alberta, all “D–” performers. Saskatchewan and Alberta are the worst ranked by a wide margin, emitting NOx at roughly six to seven times the rate of Ontario, the top-ranked province.
How do the territories fare on nitrogen oxides emissions?
The territories have higher per capita NOx emissions than most of Canada’s provinces. Yukon has the lowest emission rate of the three, at 52 kg per capita, scoring a “C” grade. The other two territories fare worse than Alberta, the bottom-ranked province, and get “D–” grades for NOx emission rates of 186 kg per capita (Nunavut) and 278 kg per capita (Northwest Territories).
The Northwest Territories’ extremely high NOx emissions rate is primarily attributed to the mining and rock-quarrying industry, with over 60 per cent of the territory’s NOx emissions coming from this industry. Most of the rest comes from electricity generation and transportation.2 Nunavut’s NOx emissions come largely from transportation (55 per cent) and electricity generation (38 per cent), with marine transportation responsible for over half of the total transportation emissions.
The territories are not included in the overall provincial and international benchmarking calculations because data for each individual territory were not available for several of the indicators included in the overall environment report card. The Conference Board is, however, committed to including the territories in our analysis, and so we provide information on territorial performance when data are available.
How has the performance of Canada and the provinces changed over time?
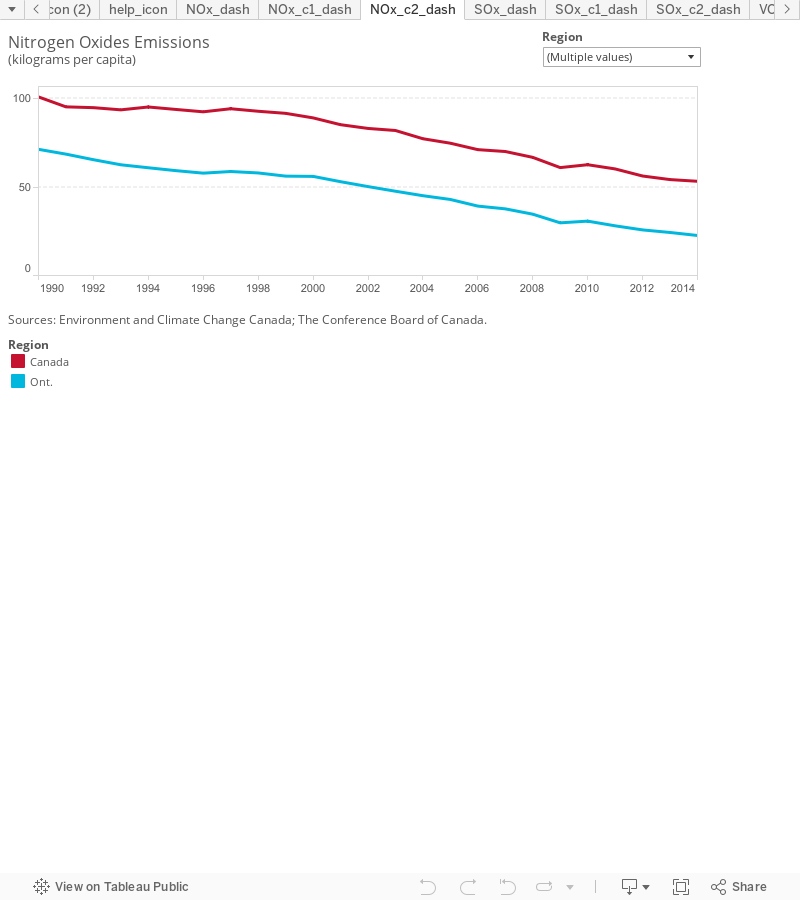
Since 1990, per capita NOx production in Canada has decreased substantially, from 101 kg to 53 kg in 2014, a reduction of 47 per cent. All the provinces have contributed to this reduction. The largest reduction was achieved by Ontario (68 per cent). So, although Canada’s NOx emissions are high relative to most peer countries, the situation is improving.
Can Canada’s provinces reduce nitrogen oxides emissions unilaterally?
Polluting emissions ignore geographical borders and therefore require inter-regional partnerships to devise effective, sustainable solutions. Air pollution from the U.S., for example, is carried into southern Ontario, southern Quebec, and the Atlantic provinces, raising ambient air pollutant levels in these regions. Emissions transported from the U.S. can increase Canada’s NOx concentration and contribute to increases in ground-level ozone, a precursor to smog. Similarly, NOx emissions produced in one province can affect the environment and air quality in other provinces. Therefore, reductions in NOx emissions benefit not just the province that has reduced emissions but surrounding regions as well, so there is an incentive for provinces to work together to reduce emissions.
To that end, in 2012, the Canadian Council of Ministers of the Environment (an intergovernmental council that facilitates cross-jurisdictional environmental action across the territorial, provincial, and federal governments), with the exception of Quebec, agreed to implement a nationwide air quality management system—a set of guidelines for monitoring emissions and setting emissions standards. The system contains air quality standards—set out in the Canadian Ambient Air Quality Standards (CAAQS)—for fine particulate matter (PM2.5) and ozone. Standards for nitrogen dioxide (NO2) and sulphur dioxide (SO2) are being established. The air quality management system also defines air zones (within provinces and territories) and regional airsheds (across provincial and territorial boundaries) to guide cross-jurisdictional cooperation to achieve the CAAQS. Further, it establishes base-level industrial emission requirements to unify emissions standards for industry in Canada and requires that ambient air quality and emissions data be publicly available.
In June 2014, the Government of Canada proposed new mandatory emission regulations that would apply to industry, called the Multi-Sector Air Pollutants Regulations. If these regulations are adopted and phased in over time as planned, the resulting reduction in NOx emissions (relative to a business-as-usual scenario) could save Canadians roughly $1.2 billion (in 2012 constant dollars) in health costs between 2013 and 2035.3
Footnotes
1 David Suzuki Foundation, The Maple Leaf in the OECD: Comparing Progress Toward Sustainability (Vancouver: The David Suzuki Foundation, 2005).
2 Environment and Climate Change Canada, Air Pollutant Emission Inventory (accessed March 22, 2016).
3 Canada Gazette, Multi-Sector Air Pollutants Regulations. The estimated saving in health costs is the sum of the health benefits from reduced NOx emissions from engines, boilers, and heaters used by industry (tables 10 and 20). The health impacts of reduced NOx emissions from cement manufacturing facilities are aggregated with health impacts of reduced SOx (Table 25).