
PhD Graduates
Key Messages
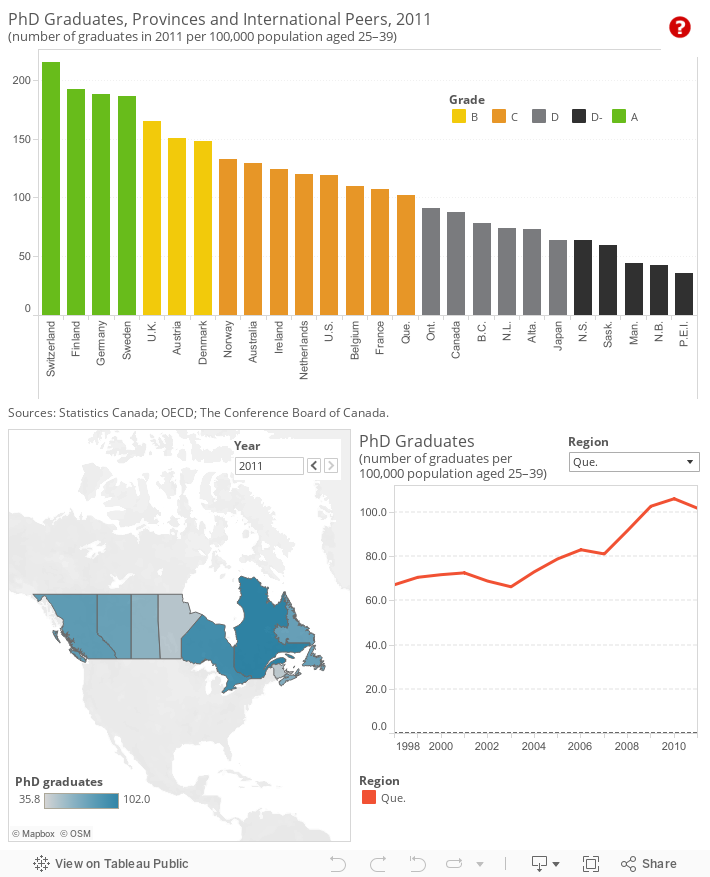
- Quebec is the only province to earn a “C” on PhD graduates; the remaining nine provinces get either “D” or “D–” grades.
- Five of the provinces get “D–” grades for PhD graduation rates that are lower than that of the lowest-ranking peer country, Japan.
- The high number of graduates who intend to leave Canada after completing their PhD studies further magnifies the issue of low provincial PhD graduation rates.
Putting PhD graduates in context
Highly skilled people are key to the creation, commercialization, and diffusion of innovation. Doctorate holders are not only qualified to conduct advanced research, but they are also an important receptor community that takes new ideas and technologies to produce new or improved products and services. With their knowledge and expertise, doctorate holders are well positioned to create new firms and jobs that will advance the economy.
We examine the 25–39 age cohort because the OECD reports that this range is typical for advanced research program graduates in our comparator countries.1
How do the provinces rank on doctoral graduation rates relative to Canada’s peer countries?
Provincial PhD graduation rates are strikingly low compared with the graduation rates of Canada’s peer countries. Overall, Canada ranks in second-to-last place among the peer countries. Five provinces score “D–” grades, with lower completion rates than the lowest-ranking peer country, Japan. Four of the provinces score “D” grades. Quebec is the top-performing province, earning a low “C” grade with a graduation rate just above Ontario’s “D” rate.
Why is Canada at the back of the class?
Canada’s low PhD graduation rate appears to be a structural issue across the country, as all provinces consistently produce proportionately fewer PhDs than most comparator countries. Despite the importance of PhD graduates to innovation, Canada’s private sector does not provide strong enough incentives for students to strive for advanced science and technology skills and for business management skills. Compared with firms in the U.S., Canadian firms in most industries hire fewer PhD graduates and pay them less; this may be one reason why there are fewer students pursuing doctoral studies across Canada.2
A recent OECD report on Canada’s education performance noted that the poor ranking on PhD skills “may reflect in part low demand for advanced skills in the labour market.”3 As evidence, the report cites a survey of over 1,000 Canadian R&D-performing firms that revealed only 18 per cent of those firms had PhD holders working as R&D employees.4
Furthermore, Canada’s education system does not encourage enough students to complete post-graduate degrees, especially in the science and technical disciplines that underpin R&D-based innovation—perhaps because funding is too widely dispersed among an expanding number of universities. While Canada has an above-average rate of high-school, college, and university completion—which testifies to the effectiveness of the education system for most participants—it does not work as well for the more educated and innovative people at the high-end of the spectrum. Canada has not attracted as many graduates to its advanced research programs. This may be in part because Canada has tended to focus on developing regional research capacity as opposed to developing a select number of highly specialized world-leading institutions.
How do the provinces perform relative to each other?
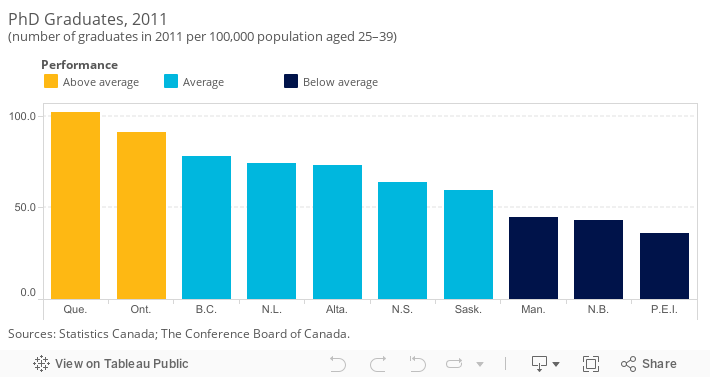
In addition to ranking the provinces against Canada’s international peers, the provinces have been compared with each other and placed into three categories: “above average,” “average,” and “below average.”5
Quebec and Ontario both have an above-average share of doctoral graduates when the provinces are compared only to each other. Manitoba, New Brunswick, and P.E.I. are below average. The three leading provinces on PhD graduates are also home to the largest universities in Canada and universities with the most extensive graduate student programs. However, where people complete graduate school is not necessarily where they will end up living. A Statistics Canada survey of PhD graduates found that over 20 per cent of doctoral graduates intended to leave Canada (at least for a period of time) when their studies were complete. No information was provided on how many PhD graduates intended to move to other provinces.6
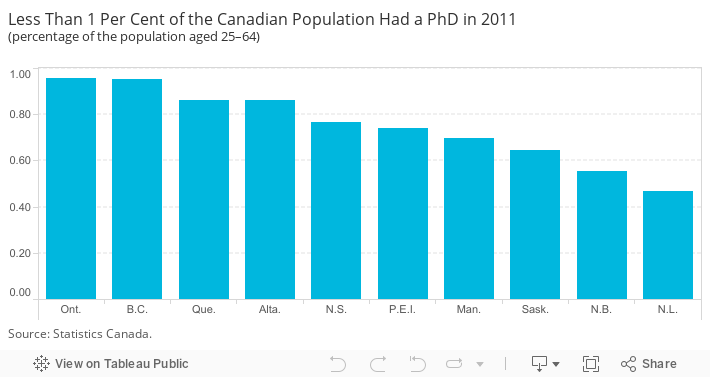
The 2011 National Household Survey provides some insights into the distribution of individuals with doctorates across the provinces. According to the survey, in 2011, 0.88 per cent of working age adults (25–64) in Canada had a PhD.7 The highest shares were in Ontario and British Columbia; the lowest rates were in New Brunswick and in Newfoundland and Labrador. More so than university or college graduates, PhD graduates are highly mobile, moving where the job market demands.8
Have provincial rankings on PhD graduates improved?
The only province to register an improvement relative to international peers is Quebec, which moved from a “D” to a “C” by 2010. However, this lack of grade improvement does not mean that no progress has been made. In fact, the Atlantic provinces have seen the greatest percentage increases in their PhD graduation rates. Over the past 10 years, P.E.I. has had an average annual growth rate of 12.7 per cent, Newfoundland and Labrador grew by 9.7 per cent, Nova Scotia grew by 8.5 per cent, and New Brunswick had a 7 per cent increase. Unfortunately, their lower starting points mean that even with this significant growth, they are still relatively poor performers.
How much would the other provinces need to improve to match Quebec’s “C”?
For Ontario—which ranked just behind Quebec—to earn a “C,” the province would need to have had 278 more doctoral graduates in 2011, raising its total from 2,415 to 2,693. Last-place P.E.I. would need to have had almost three times the number of graduates in 2011 (26 instead of 9) to be awarded a “C” grade.
Will the provinces see any improvement soon?
Other countries have fared much better than Canada on doctoral graduate rates. In 2000, nine countries scored a “D.” Since then, all the “D” performers have increased their number of doctoral graduates, but Japan and Canada registered the smallest increase. As a result, only Canada and Japan are still “D” performers.
Poor performance on this measure is a serious concern that does not bode well for the future. Canada offers fewer employment and pay incentives than do other countries to encourage students to pursue doctoral studies. Canada’s already low stock of PhD graduates continues to erode further, with over 20 per cent of doctoral graduates intending to leave Canada (at least for a period of time) when their studies are complete.9
Footnotes
1 OECD, Education at a Glance 2013 (Paris: OECD, 2013), 61.
2 Industry Canada, Mobilizing Science and Technology to Canada’s Advantage (Ottawa: Industry Canada, 2007), 31.
3 Calista Cheung, Yvan Guillemette, and Shahrzad Mobasher-Fard, “Tertiary Education: Developing Skills for Innovation and Long-Term Growth in Canada,” OECD Economics Department Working Papers, No. 991 (Paris: OECD Publishing, 2012), 25.
4 Independent Panel on Federal Support to R&D, Innovation Canada: A Call to Action (Ottawa: Industry Canada, 2011), 5-5.
5 To compare the performance of Canadian provinces relative to one another, we first determined the average score and standard deviation of the provincial values. The standard deviation is a measure of how much variability there is in a set of numbers. If the numbers are normally distributed (i.e., the distribution is not heavily weighted to one side or another and/or does not have significant outliers), about 68 per cent will fall within one standard deviation above or below the average. Any province scoring one standard deviation above the average is “above average.” Provinces scoring less than the average minus one standard deviation are “below average.” The remaining provinces are “average” performers.
6 Louise Desjardins and Darren King, Expectations and Labour Market Outcomes of Doctoral Graduates From Canadian Universities (Ottawa: Statistics Canada, Human Resources and Skills Development Canada, 2011), 21.
7 Statistics Canada, 2011 National Household Survey, Statistics Canada Catalogue no. 99-012-X2011040.
8 Laudeline Auriol, Careers of Doctorate Holders: Employment and Mobility Patterns (Paris: OECD: 2010), 18.
9 Louise Desjardins and Darren King, Expectations and Labour Market Outcomes of Doctoral Graduates From Canadian Universities (Ottawa: Statistics Canada, Human Resources and Skills Development Canada, 2011), 21.