
Economic Growth
Key Messages
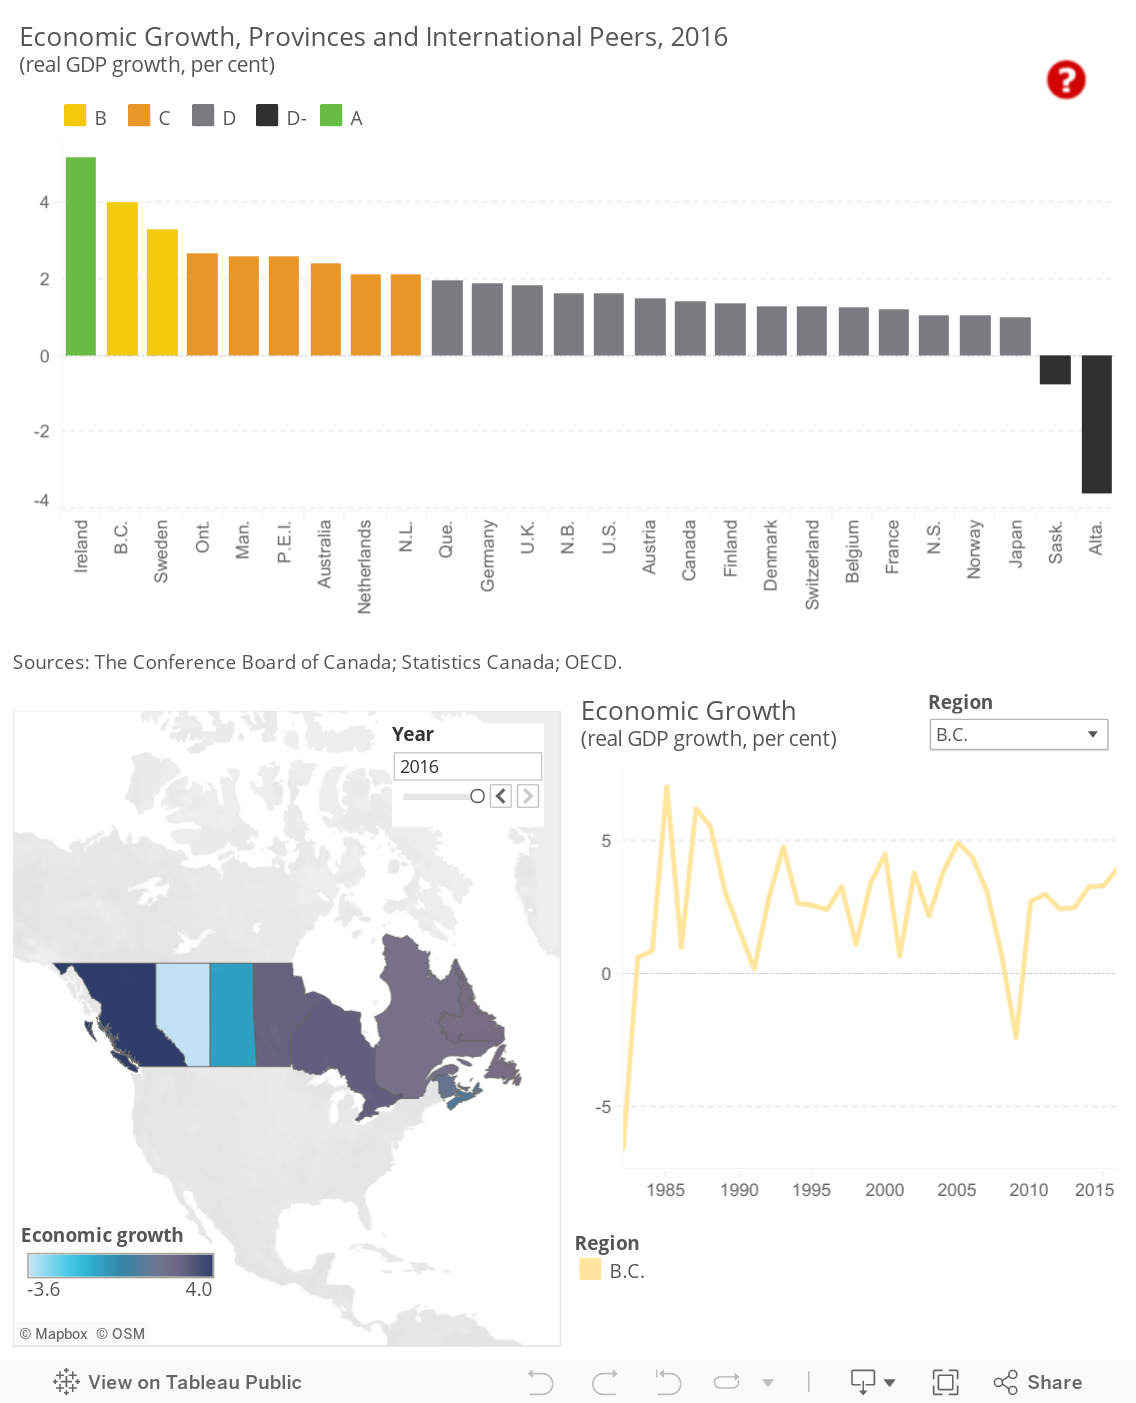
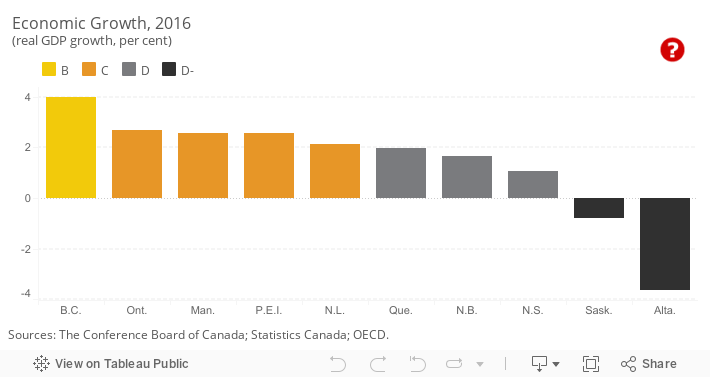
- With the highest economic growth among the provinces in 2016, B.C. gets a B and ranks behind only Ireland.
- The two oil-dependent provinces of Saskatchewan and Alberta get D– grades—both provinces saw their real GDP decline in 2016 as a result of the lagged impact of lower commodity prices.
- Overall, Canada gets a D and ranks 9th among the 16 peer countries, with 1.4 per cent real GDP growth in 2016.
Putting economic growth in context
Growth in gross domestic product, or GDP, is often used as an aggregate indicator of the increase in a country’s standard of living or prosperity. Since prices rise over time, economists remove the effects of inflation and focus on the change in real GDP, measuring the increase in the volume of goods and services being produced by an economy.
How do provincial economic growth rates compare internationally?
British Columbia’s growth of 4.0 per cent in 2016 puts it in first place in the country and second in the international rankings behind Ireland (5.2 per cent). B.C. and third-placed Sweden are the only jurisdictions to get a B grade.
Ontario gets a C and, with 2.7 per cent growth for 2016, ranks 4th overall. It is followed closely by Manitoba and Prince Edward Island, which both had 2.6 per cent growth. Despite poor performances on other indicators, Newfoundland and Labrador posted fairly strong economic growth of 2.1 per cent thanks to the construction of the Hebron oil platform and also gets a C grade.
There were many poor performances internationally in 2016, with 12 of the 16 peer countries getting Ds. Quebec is in this tier, narrowly missing out on joining the C performers with its 2.0 per cent economic growth. New Brunswick, with 1.6 per cent growth, and Nova Scotia, with 1.1 per cent growth, were the other D performers in Canada.
The lowest-ranking peer countries, Norway and Japan, both grew by 1.0 per cent in 2016. Norway is struggling with lower oil export revenues, and Japan has long struggled with slow growth. Two oil-producing provinces, Saskatchewan and Alberta, get D– grades for doing worse than the lowest-ranked peer countries and posting negative real GDP growth in 2016. Both provinces saw sharp declines in energy investment—the economy contracted by 0.8 per cent in Saskatchewan and by 3.6 per cent in Alberta.
Overall, Canada’s GDP grew by a slow 1.4 per cent in 2016, earning the country a D grade and 9th place among the 16 peer countries. The Canadian economy took a hit last year from the Fort McMurray wildfires, which disrupted production in the oil sands and pushed down exports as a result. But the fires alone are not to blame, with low commodity prices and very weak capital investment in many parts of the country.
The impact of the commodity shock is abating, however, and the Canadian economy showed meaningful strength in late 2016 and early 2017. A stronger U.S. economy will help provide a tailwind for Canada, and the prior contraction in business investment is drawing to a close. But global growth remains weak, dampening the outlook for Canadian exports to many markets, and investment is not yet high enough to push the economy into another gear.
How do the provinces perform relative to each other?
There was a large disparity in growth rates among Canadian provinces in 2016. B.C. led Canada in growth for the past two years on the strength of a strong housing sector and domestic economy. Second-place Ontario’s economy has been buoyed by the same factors as B.C.: a booming housing sector and strong consumer demand.
Economists had expected a contraction in Newfoundland and Labrador in 2016, so its growth of 2.1 per cent was unexpectedly strong. It beat expectations in large part because of a major one-off construction project, the Hebron oil platform, which employed up to 3,000 people.1 As the platform transitions to production this year, these jobs—and the economic tailwind that came with them—will wind down.
Saskatchewan and Alberta had another difficult year in 2016. Both provinces had a number of A+ growth years during the 2000s and early 2010s thanks to high oil and other commodity prices, and they were responsible for driving Canadian growth in most of those years. Now that oil prices are lower, they find themselves dragging down Canadian economic growth.
Have the provinces’ report cards on economic growth improved over time?
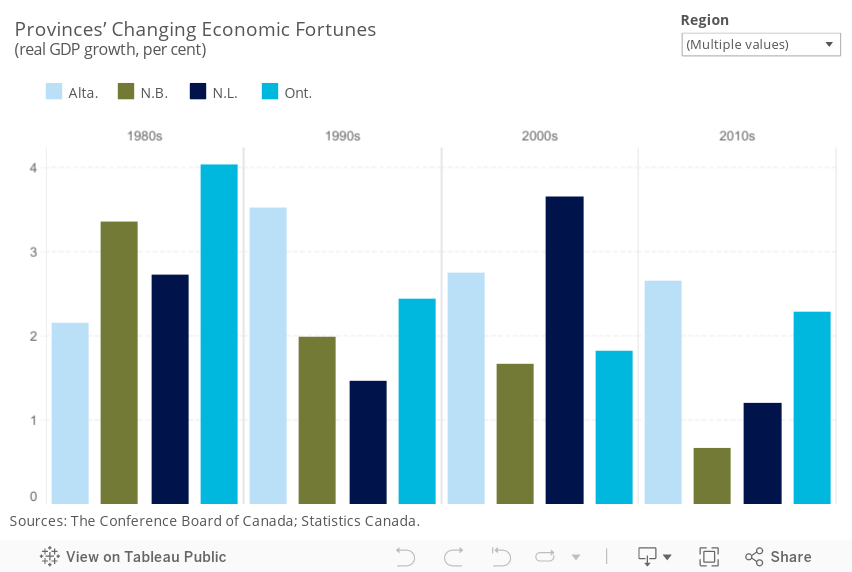
The grades for many of the provinces have changed over the past few decades, partly because of structural changes in the global and Canadian economies.
The commodities price crash has significantly changed the growth outlook for some provinces. Newfoundland and Labrador had jumped from being an overall D performer in the 1990s to an A performer in the 2000s thanks to the development of its offshore energy resources and rising iron ore and nickel production. With the resource sector now struggling, the province has fallen back down to a D grade this decade—although it managed to get a C in the most recent report card. Saskatchewan, Alberta, and B.C. also graduated from D– or D rankings in the 1980s to B and C grades in the 2000s thanks to high demand and prices for their resource exports. All three have now fallen back to average C-grade performance in the 2010s.
Some provinces have seen more consistent trends in one direction over time. Ontario scored an A for the 1980s, when the combination of solid growth in the U.S. economy and a loonie that traded far below par against the U.S. dollar led to strong growth in exports and manufacturing activity. However, the province has been a C performer, on average, for both the 2000s and 2010s. Starting in the early 2000s the loonie, fuelled by soaring commodity and oil prices, appreciated from a low of US$0.62 to exceed par. The combination of a rising loonie and a U.S. economy that suffered two tough recessions in the 2000s led to a sharp drop in demand for Ontario’s exports to the United States; the resulting slump in economic activity hurt real GDP growth in the province.
Similarly, Nova Scotia and New Brunswick, which were both B performers in the 1980s, have fallen to a D average in the 2010s.
Quebec has seen little change in its growth rate over time. The province scored Ds in the 1980s and 1990s and, despite graduating to a C in the 2000s, has fallen back to a D in the 2010s to date.
How have the territories fared on economic growth?
The territories had widely divergent growth rates in 2016. Yukon gets an A+ for 8.3 per cent real GDP growth. Nunavut gets a B grade for 3.9 per cent growth, just below the fastest-growing province (B.C.). The Northwest Territories, meanwhile, gets a D– grade for doing worse than the lowest-ranking peer country, Japan (1.0 per cent). N.W.T. had 0.4 per cent growth in 2016.
Yukon’s strong growth was driven by mining output, but it won’t last. A decline in mining output will detract from economic growth in 2017. N.W.T.’s economy stagnated in 2016 due to some small mine closures and the ramping down of construction at a major new diamond mine. But that new mine will help generate stronger growth. Nunavut’s growth was broad-based, with infrastructure projects, government spending, and increased mining output all contributing. A significant increase in mining output will buoy the territory’s economy over the next few years.
All three territories have largely resource-dependent economies. A dependence on resource extraction is precarious for two reasons: it is often difficult to obtain financing to develop new mines, and prices fluctuate sharply as a result of changing conditions in the global economy. In this sense, the territories face similar challenges to many emerging markets and other resource-dependent regions, where a heavy reliance on natural resources for wealth and job creation leaves the economy susceptible to swings in commodity prices.
The territories are not included in the overall rankings because data are not available for all of the indicators in the economy report card. The Conference Board is, however, committed to including the territories in our analysis, and so we provide information on territorial performance when data are available, such as for economic growth.
The Conference Board of Canada produces a biannual Territorial Outlook report that examines the economic and fiscal outlook for each of the territories, including output by industry, labour market conditions, and the demographic make-up of each territory. The Territorial Outlook can be accessed online through e-Library and for clients subscribing to e-Data.
Research on issues affecting the territories is also produced by the Centre for the North, a Conference Board initiative that began in 2009.
Will the oil-rich provinces recover?
Commodities prices appear to have reached the bottom of their cycle and oil prices are expected to average in the US$50 range in 2017 and edge further upwards in the coming years. Accordingly, although economic growth is unlikely to return to the highs of the oil boom years, the worst is behind Alberta and Saskatchewan, and they are expected to return to positive growth. In Alberta, the Fort McMurray reconstruction will also help boost GDP.
Despite surprisingly strong growth in 2016, Newfoundland and Labrador is facing a much bleaker outlook in 2017. There is a lack of new investment in the province, the provincial government is implementing austerity measures to balance the budget over several years, and fishing quotas have been cut for 2017.
Is Ontario’s growth the sign of an industrial renaissance?
Ontario once led the country in economic growth. Its manufacturing sector, particularly the auto and auto parts industry, played a major role in this success. Are the weak loonie and strong growth in Ontario signs that this sector will return to being the engine of Canada’s economy?
Better times are certainly ahead for manufacturers, but caution is in order. Most of Ontario’s 2016 growth came thanks to consumer spending rather than merchandise exports. Business investment in machinery and equipment, which is crucial to improving the province’s productive capacity, remains low. If the manufacturing sector is to generate stronger growth, major new investments are needed, but none have occurred in recent years. As things stand, Ontario’s future is shifting toward high-value-added services and high-tech manufacturing plugged into global supply chains.
How does higher economic growth contribute to well-being?
There are many reasons to care about the precise rate of economic growth. First, even small growth rates can reflect large dollar amounts in the context of a national economy. For example, although a 1 percentage point increase in growth may sound insignificant, in 2016, Canada’s economy produced just over $2.0 trillion in goods and services—so 1 per cent represented $20 billion, or roughly the entire amount earned by charities and non-profits in 2016.
Second, a constant level of income in an economy is not adequate to keep up with the increase in the cost of living caused by inflation. Inflation was 1.4 per cent in Canada in 2016, meaning that the economy had to grow by 1.4 per cent (in nominal terms) just to maintain living standards.
But the rankings in this report card are based on real GDP growth, so they already account for inflation. Isn’t it true that, even with zero real GDP growth, wages and salaries will still more or less keep pace with inflation? Not quite: although an economy experiencing zero real GDP growth will be able to afford the same volume of goods and services as in previous years, that income will be spread thinner and thinner each year as the population grows. Canada’s population grew by 1.2 per cent last year, so for income per person to remain constant, the economy would have to have grown by 1.2 per cent above and beyond inflation.
Only when an economy is growing fast enough to keep pace with both inflation and population growth can economic growth begin having a positive impact on living standards. Therefore, it is important to look at both real GDP growth and income per capita as measures of economic performance.
Even a slightly higher growth rate can make a major difference in well-being over time. Canada’s real GDP in 2016 was $1.8 trillion (2007 dollars), or $49,500 per person. A generation before, in 1991, it was $978 billion (2007 dollars), or $34,900 per person. The average annual growth in real GDP over that time was 2.5 per cent. If Canada’s economy had grown 1 percentage point slower each year—1.5 per cent average growth—then Canada’s real GDP today would be $1.4 trillion (2007 dollars), or $39,100 per person, instead. Although a difference of 1 per cent in any given year may not be felt by the average person, a change in average growth of 1 percentage point over these years would have translated to a 21 per cent difference in real income per capita, which would certainly be felt by all.
Higher economic growth is important for another reason too. Because it raises incomes and corporate profits, it raises government revenues even with taxes held constant. Countries across the developed world face an aging population and a growing ratio of dependents to working-age people. With an aging population comes rapidly rising costs for public services, such as health care and pensions. And with a growing dependency ratio these rising costs are borne by taxpayers making up a smaller and smaller share of the population.
As governments face these pressures, they can respond by diminishing the quality of the services, by cutting spending on other programs, or by raising taxes. None of these are attractive options. Healthy economic growth will, therefore, be key to ensuring the sustainability of government finances over the coming decades.
Footnotes
1 CBC News, Hebron Project Reaches Key Milestones, October 28, 2016.