
VOC Emissions
Key Messages
- Canada ranks a dismal last place out of 17 countries and earns a “D” grade.
- Canada is not acting as quickly as its peers to reduce VOCs in consumer and commercial products, such as cleaning products, personal care products, paints, and printing inks.
- Between 1990 and 2009, Canada reduced its per capita VOC emissions by 41 per cent, but Switzerland and the U.K. reduced per capita emissions by more than 70 per cent.
Putting VOC emissions in context
Volatile organic compounds (VOCs) are produced by vehicle emissions, chemical manufacturing, the evaporation of automotive fuels and other petroleum-based products, and chemical solvents. Consumer and commercial products that often contain VOCs include household cleaning products, personal care products, paints, and printing inks.
VOCs form particulate matter (PM) and react with nitrogen oxides to form ground-level ozone that forms smog.
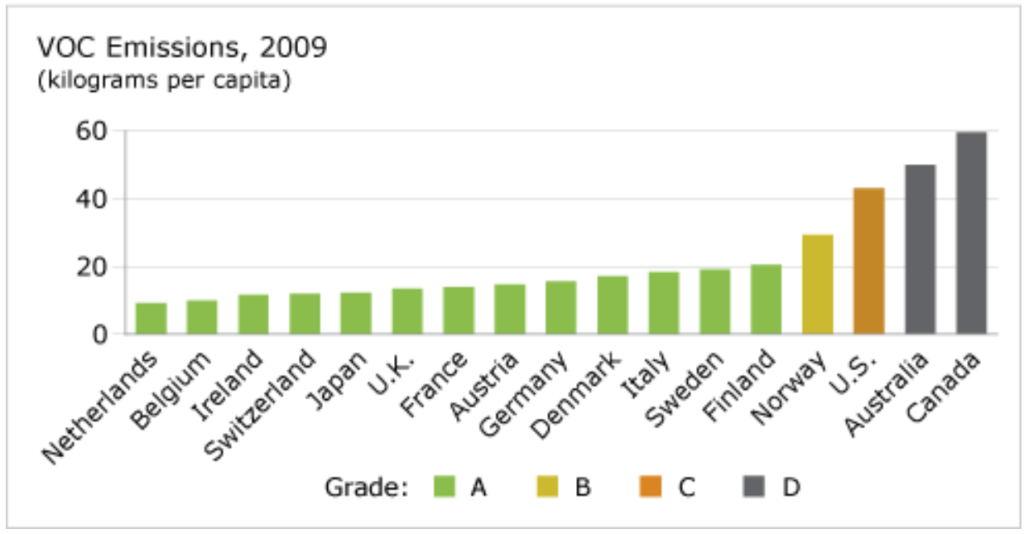
How do Canada’s VOC emissions per capita compare to those of other countries?
Canada ranks a dismal last place out of 17 peer countries. In 2009, Canada produced almost 60 kilograms of VOCs per capita. That’s six times more than the Netherlands, the best performer. Most of the European countries—except Norway—and Japan received “A” grades. Canada and Australia were the only countries to receive a “D” on VOC emissions per capita.
What progress have Canada and its peers made in reducing VOC emissions?
Canada has reduced VOC emissions per capita by 41 per cent since 1990, but its peers have done more. The U.S., for example, reduced emissions by 49 per cent. Countries making the most progress are Switzerland, with a 73 per cent reduction, the U.K., with a 71 per cent reduction, and the Netherlands, with a 70 per cent reduction.
Has Canada’s report card on VOC emissions improved?
Historically, Canada has been a poor performer on VOC emissions. Canada received a “D” grade throughout the 1990s and 2000s.
Although the U.S. also earned a “D” in the 1990s, it has since improved to “C.”
The only other country to earn a “D” for the 1990s is Norway, and it moved up to a “C” in the 2000s.
What contributes most to VOC emissions in Canada?
VOC emissions result from both natural sources and human activities. Natural sources of VOCs include vegetation, forest fires, and animals. Although natural sources of VOC emissions are larger overall, human activities in populated and industrialized areas are the main contributors to air quality problems.
The oil and gas industry is the largest contributor to VOCs in Canada (with 32 per cent of emissions), followed by the use of paints and solvents (18 per cent). Off-road vehicles are next (15 per cent), while all other transportation is responsible for about 12 per cent.1
What is being done to reduce VOC emissions in Canada?
Canada still lags behind other industrial countries in reducing VOC emissions in consumer and commercial products. Federal government regulations have recently started to target reductions of VOC’s emitted by the manufacture and use of cleaning products, personal care products, paints, and printing inks, which account for nearly half of all solvent-related VOC emissions. In December 2006, the government published regulations that set limits for the concentration of 2-butoxyethanol—found in cleaners, paints, and coatings—in commercial and consumer products intended for indoor use.2
The federal government has indicated it will develop further regulatory and non-regulatory measures to reduce VOC emissions in Canada. In April 2008, the government brought forward regulations to limit VOC’s in architectural and industrial maintenance coatings, automotive refinishing coatings, and selected consumer products.3
The government has also announced it will create a strategic plan to guide action in other consumer and commercial products sectors.4 At this stage, the government is gathering data on VOCs to drive the strategic plan. Some VOCs will be assessed for various health and environmental impacts.
The proposed measures will align the VOC content limits, where appropriate, with requirements in the United States. They may also increase opportunities for the Canadian industry to compete in the North American market on an equal footing.5
Achieving progress on this indicator has been constrained by Canada’s failure to ratify the 1991 Geneva Protocol to the Convention on Long-range Transboundary Air Pollution combined with a lack of VOC reduction targets.6
How do VOC’s affect quality of life for Canadians?
VOC emissions in high concentrations contribute to smog, which has both health and environmental impacts. Children, people with respiratory diseases (such as asthma), and people who work or exercise outside are susceptible to damage to lung tissue and reduction in lung function. Ozone can be transported by wind currents and affect regions far from original sources, damaging vegetation and crop yields in rural areas. Crops such as wheat, corn, soybeans, and tomatoes are particularly sensitive to ground-level ozone.
Footnotes
1 Environment Canada, “Volatile Organic Compound Emissions” (accessed November 21, 2012).
2 Government of Canada, “Canada’s New Government announces targets to tackle climate change and reduce air pollution,” December 4, 2007 (accessed August 19, 2008).
3 Environment Canada, “Volatile Organic Compounds in Certain Products” (accessed November 21, 2012).
4 Government of Canada, “Canada’s New Government announces targets to tackle climate change and reduce air pollution,” December 4, 2007 (accessed August 19, 2008).
5 Government of Canada, “Canada’s New Government announces targets to tackle climate change and reduce air pollution,” December 4, 2007 (accessed August 19, 2008).
6 David Suzuki Foundation, The Maple Leaf in the OECD: Comparing Progress Toward Sustainability (Vancouver: The David Suzuki Foundation, 2005), 18.