
Labour Productivity Growth
Key Messages
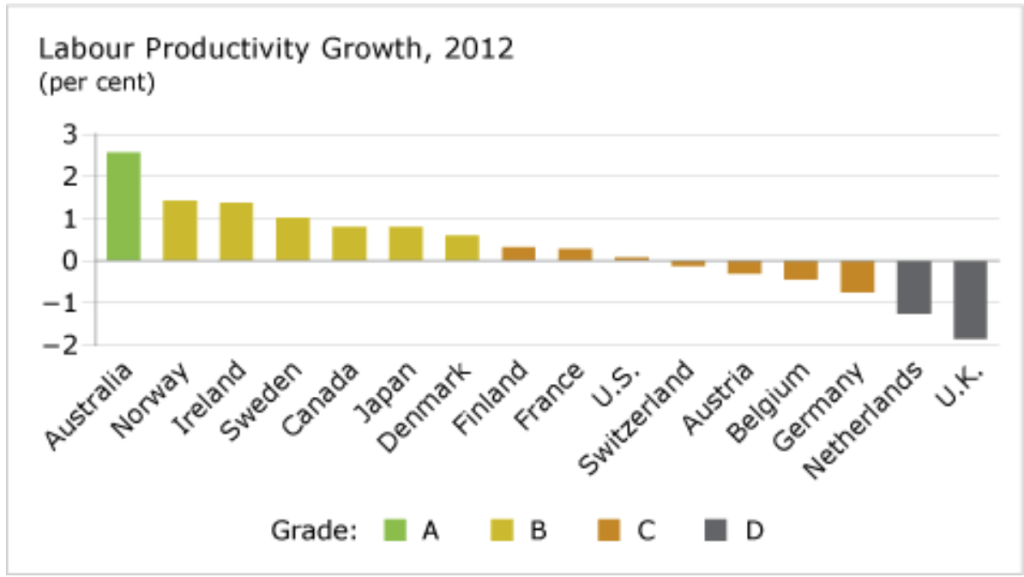
- Canada achieves a “B” grade for labour productivity growth, placing 5th among the 16 comparator countries.
- Australia is the top performer and the only country to merit an “A.”
- Six countries suffered declines in output per hour worked in 2012—a reflection of the severity of economic conditions across much of Europe.
Putting labour productivity growth in context
Productivity is the single most important determinant of a country’s per capita income over the longer term. Countries that are innovative and able to adapt to the ebb and flow of the new global economy boast high productivity and thus a superior standard of living. Productivity is a measure of how efficiently goods and services are produced.
Measuring productivity in Canada: How does Canada measure up?
Canada’s labour productivity growth has been lower than that of the top countries for many decades, hurting its international competitiveness. Canada’s relative performance on this indicator improved in 2012, earning a “B” grade and ranking 5th among the 16 countries. However, Canada’s labour productivity growth rate in 2012 was only 0.8 per cent, not an impressive number by historical standards. Canada’s ranking improved only because other countries did relatively worse.
Which is more important: productivity growth or productivity levels?
Productivity growth and productivity levels are both important. While the focus in the media is most often on productivity growth rates, the actual level of productivity (that is, the dollar value of output per hour worked) is equally of interest.
Low productivity levels present an enormous challenge for Canada’s future economic prosperity. In 2012, Canada’s level of labour productivity was US$42, much lower than that of the United States, at US$52. This earned Canada a disappointing 13th place among its 16 peer countries on the level of labour productivity. Only Finland, Switzerland, and Japan were lower. Worse still, Canada’s labour productivity level has fallen to 80 per cent of the U.S. level from a high of 91 per cent in the mid-1980s. Despite a broad and growing consensus that Canadian productivity needs to be improved, the gap with the U.S. is widening, not narrowing.
Has Canada’s productivity performance improved over time?
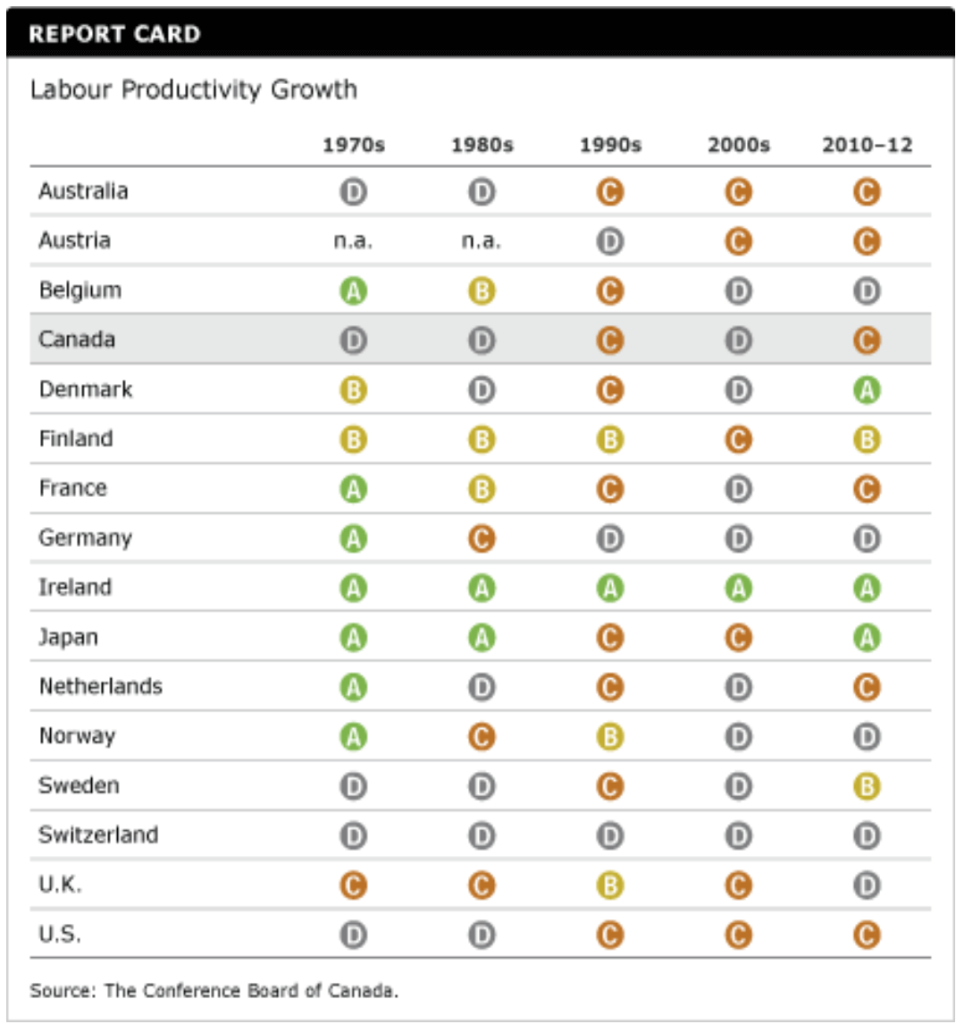
Measuring productivity in Canada shows that annual productivity growth has actually declined since the 1970s. Many of Canada’s peers, however, have also experienced a decrease in productivity growth over the past four decades. Canada’s improved letter grade—from a “D” in the 2000s, to a “C” for 2010–12 and a “B” in 2012—merely reflects its improved relative performance.
It can be difficult to get a clear picture of productivity growth over time because it is highly cyclical. The Hodrick-Prescott filter1 is used to provide an improved impression of long-term trends in productivity growth by eliminating short-term fluctuations. It helps show that most comparator countries have experienced a progressive deceleration in trend productivity growth. Canada’s trend productivity growth matched that of the U.S. in the 1970s, first began to lag in the mid-1980s, and has since remained disappointingly low.
Do the countries with the highest productivity growth lead the class in overall economic performance?
Not necessarily. Because productivity is volatile year-to-year, the results can be confusing. Norway is a good example of this; it recorded “C”s and “D”s between 2006 and 2011, yet still managed to make top grades in other areas. This may be because its trend productivity growth is relatively high and, more importantly, Norway remains the leader in actual dollar value of productivity (US$65 per hour worked).
Why all the angst about the Canada–U.S. productivity gap?
Canada’s productivity growth has lagged that of many of its peers. In the 1970s, Canada’s labour productivity grew an average of 1.5 per cent annually, compared with the U.S. average of 1.6 per cent per year. Both countries suffered a decline in growth in the 1980s.
The 1990s were challenging for Canada; the country saw its economic position relative to the U.S. erode sharply. U.S. productivity growth was fuelled by significant investment in the U.S. in machinery and equipment, particularly information and communications technologies. The U.S. productivity continued to grow faster than that of Canada in the 2000s, only recently falling slightly below.
Moreover, a large Canada–U.S. gap has developed in multifactor productivity (MFP) growth. Statistics Canada describes MFP growth as “the residual portion of labour productivity growth that is not accounted for by increased capital intensity and skills upgrading.”2 MFP growth measures the efficiency with which capital and labour are used in production. MFP growth is often interpreted an innovation. Canadians have become laggards in innovation, in both products and services, as well as in business processes.
Can Canada narrow the productivity gap with the United States?
Canada has narrowed the gap slightly in the past two years, with labour productivity growing a bit faster in Canada than in the United States. Nevertheless, it will be difficult to close the productivity gap fully. Countries with lower levels of productivity not only have to achieve faster growth to catch up, but they also need to maintain that faster growth for an extended period of time.
For example, if U.S. productivity were to grow by 1.11 per cent per year (its most recent five-year annual growth rate), Canada’s productivity growth would have to be over twice as fast—2.64 per cent per year—over the next 15 years to eventually match the U.S. productivity level. That’s a near-insurmountable four times Canada’s average annual productivity growth rate over the past five years. Closing the productivity gap with the U.S. is essential to closing the income gap, but Canada is not making any material progress.
Are Canadians not working hard enough?
Many people confuse the concept of productivity with that of work intensity. Improving productivity is not about working longer or harder; it’s about working smarter. It’s about finding more efficient and effective ways to produce goods and services so that more can be produced with the same amount of effort. It’s also about producing higher-value-added products and services that are worth more in the marketplace. The onus of improving productivity lies not just with governments, but with individual firms and their management.
Take, for example, the auto manufacturer that introduces new robotics technologies that cut the time it takes to assemble cars, meaning that the same number of workers can now produce more cars per day, without working longer or harder. Or the auto manufacturer that adds a GPS system to a car model that retails for $30,000. The innovative technology increases the sales price by $3,000. Because the redesigned car takes the same amount of time to build, however, labour productivity—in terms of output per worker—is boosted by 10 per cent.
Challenges to improving productivity are multi-faceted. To enhance productivity, Canada must foster a culture of business innovation, open industries to competitive pressures, improve the level and quality of capital intensity, and develop a supportive policy environment.
What drives productivity growth?
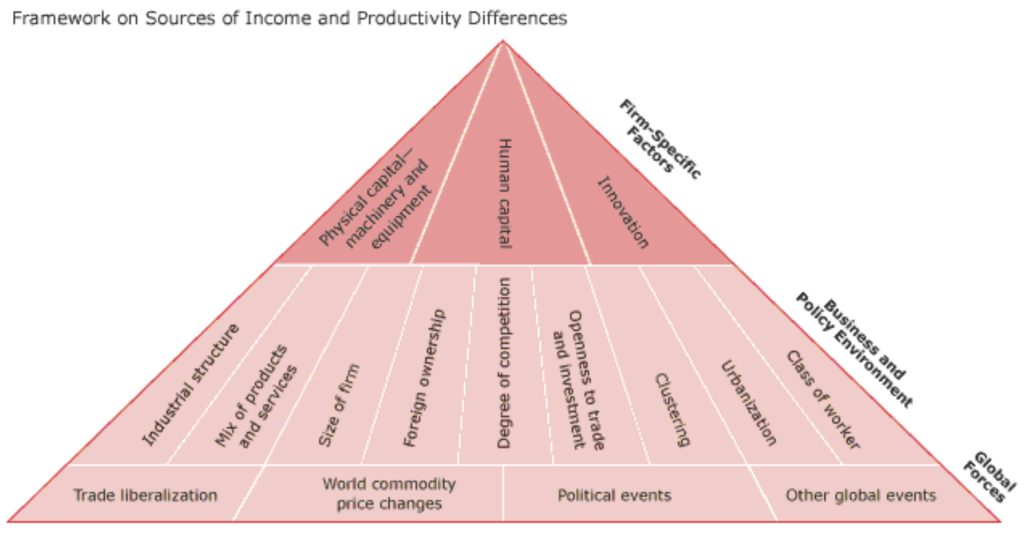
The Conference Board has developed the diagram below to illustrate the key drivers of productivity. At the top are firm-specific factors. These factors relate to the physical and human capital, as well as innovation and technological change, in a particular organization.
The middle layer is the business and policy environment within which the firm-specific factors coalesce. For example, if an organization is in a highly competitive field, this competitive environment can have an indirect influence on productivity through its effects on the firm-specific variables.
The bottom layer is dynamics in the global economy. Canada has influence over some of these dynamics, such as trade liberalization. Others, like changes in global commodity prices, are essentially beyond the control of any individual country.
How can Canada reduce its productivity gap?
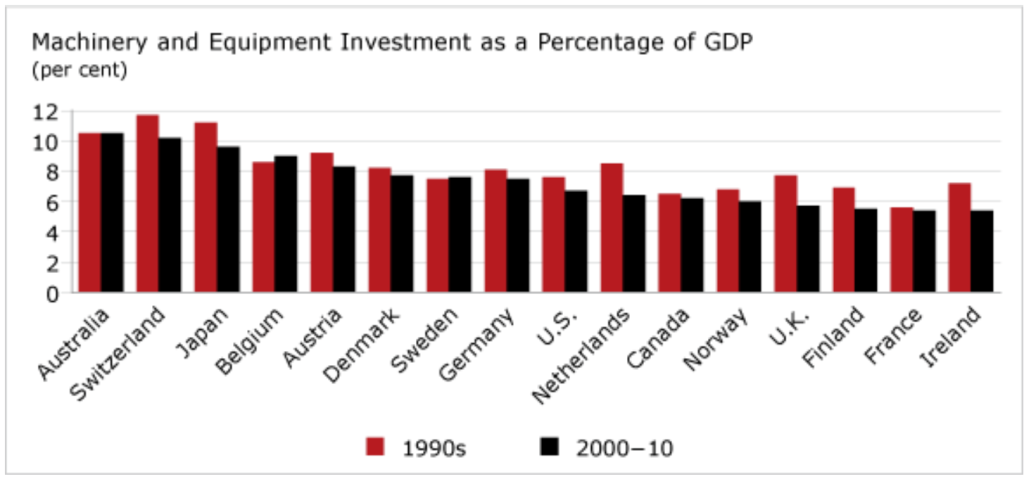
Investing in machinery and equipment—particularly information and communications technology—enables the adoption and diffusion of the latest state-of-the-art technologies, which in turn boost productivity. We know that countries with higher investment in machinery and equipment generally have higher productivity growth. The chart below shows that Canada’s investment in machinery and equipment as a percentage of gross domestic product (GDP) is among the lowest of its peer countries.
Canada’s productivity gap also reflects its weaker inward and outward foreign direct investment, low R&D intensity, a weak innovation record, and the relatively small percentage of Canadians with advanced degrees in science and technology.
Footnotes
1 The Hodrick-Prescott filter is a mathematical tool used in economics to obtain a smoothed non-linear representation of a time series, one that reflects long-term trends rather than short-term fluctuations. Robert Hodrick and Edward Prescott, “Postwar U.S. Business Cycles: An Empirical Investigation,” Journal of Money, Credit, and Banking 29, 1 (February 1997), 1–16.
2 Statistics Canada. Multifactor Productivity Growth Estimates, 2011. http://www.statcan.gc.ca/daily-quotidien/120817/dq120817d-eng.htm.