
Greenhouse Gas (GHG) Emissions
Stay up to date
Looking for the latest in sustainability planning? Create a CBoC account and sign up for email updates.
Key Messages
- Quebec is the only province that ranks well on the international report card for GHG emissions, placing 7th and receiving an “A” grade.
- Alberta and Saskatchewan score “D–” grades with much higher per capita GHG emissions than the worst-ranked peer country, Australia.
- Overall, Canada’s per capita GHG emissions are very high, earning Canada a “D”—only the U.S. and Australia fare worse.
Putting GHG emissions in context
Climate change is now the most serious global environmental threat.1 Its potential impacts include global warming, sea level rise, increased extreme weather events, and altered rainfall patterns. Climate change is a direct consequence of elevated greenhouse gas (GHG) concentrations in the atmosphere, resulting in increased atmospheric heat retention and rising global average temperatures.
Warmer temperatures also trigger feedback mechanisms that contribute further to climate change. For example, as polar glaciers melt, their surface area decreases, and so they reflect a smaller amount of sunlight back out of the atmosphere. This further increases the rate of global heat retention, exacerbating the rate of climate change.
There are several types of GHGs—including carbon dioxide (CO2), methane (CH4), and nitrous oxide (N2O)—each with different capacities to retain atmospheric heat. To simplify comparisons, and calculate the aggregate impact of all different types of GHGs, GHG emissions are typically measured in terms of CO2 equivalence (CO2e). This is the amount of CO2 emissions that the GHG emissions are equivalent to, in terms of the amount of heat they trap in the atmosphere.
Most GHG emissions come from fossil fuel combustion, and so monitoring energy consumption is key for tracking contributions to climate change. The main challenge is to make economic growth depend less on energy use, by improving energy efficiency and by developing and using cleaner fuels and low-emitting electricity sources.2
Other sources of GHG emissions include fugitive emissions released during oil and natural gas extraction, emissions from industrial production processes that do not involve combustion, emissions from agriculture (e.g., methane produced by cows), and emissions from waste management.
There are also indirect sources of GHG emissions, resulting from land-use, land-use change, and forestry (known as “LULUCF”). That is, when landscapes change, GHGs can be emitted or absorbed. Because plants absorb atmospheric CO2 as they grow, cutting down trees, for example, results in a net increase in GHG emissions, while planting trees reduces atmospheric CO2. Wildfires are also responsible for both direct and indirect GHG emissions. These indirect and natural sources of GHG emissions (positive or negative) are not typically included in international GHG emission comparisons, so have likewise been excluded here.
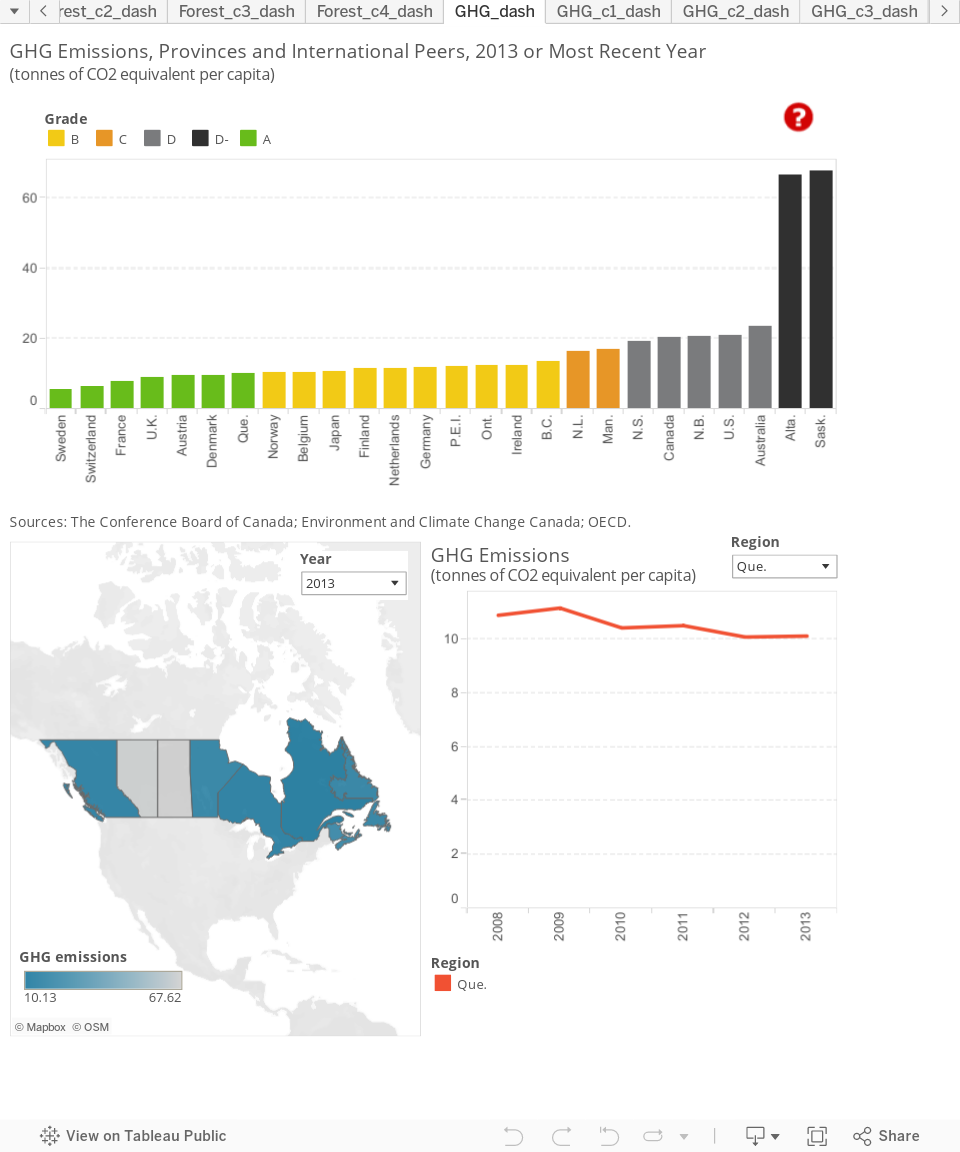
How do the provinces rank relative to Canada’s international peers?
Quebec is the only province with an “A” grade on GHG emissions, with roughly 10 tonnes CO2e per capita, ranking 7th overall. Quebec’s emission rate is on par with rates in Austria (9.4), Denmark (9.7), and Norway (10.6).
Three provinces receive “B” grades, P.E.I. (12.4), Ontario (12.6), and B.C. (13.7), and fall in with the Netherlands (11.7), Germany (11.8), and Ireland (12.8).
No international peers receive a “C” grade, but two provinces do: Newfoundland and Labrador (16.3) and Manitoba (16.9), produce 16–17 tonnes CO2e per capita.
Nova Scotia, New Brunswick, Alberta, and Saskatchewan are the lowest-ranking provinces. Nova Scotia’s 19.4 tonnes CO2e per capita and New Brunswick’s 20.8 tonnes earns these provinces “D” grades, with emission levels comparable to the U.S. (21.0) and Australia (23.4), the worst-ranked countries. Alberta (66.7) and Saskatchewan (67.6), however, are in a league of their own. With per capita emissions of over 65 tonnes CO2e, these provinces are the lowest-ranked across all jurisdictions and score “D–” grades.
Overall, Canada ranks 14th among the 16 peer countries and scores a “D” with 20.7 tonnes CO2e emissions per capita.
How do the provinces perform relative to each other?
The emissions of most of Canada’s provinces fall within 10–20 tonnes CO2e per capita. Quebec is the top-ranked province with 10.1 tonnes CO2e per capita.
On the opposite side of the spectrum are Alberta and Saskatchewan with emission rates of nearly 70 tonnes CO2e per capita. These provinces emit over six times as much GHG as Quebec and over three times as much as the national average.
How do the territories fare on GHG emissions?
Yukon is one of Canada’s top-performing regions, emitting roughly 11 tonnes CO2e per capita and earning a “B” grade, behind only Quebec. Nunavut and the Northwest Territories (combined) are “D” performers, emitting 21 tonnes CO2e per capita. These two territories combined have a greater emission rate than all provinces other than Alberta and Saskatchewan.
The territories are not included in the overall provincial and international benchmarking calculations because data for each individual territory were not available for several of the indicators included in the overall environment report card. The Conference Board is, however, committed to including the territories in our analysis, and so we provide information on territorial performance when data are available.
How have Canada’s GHG emissions changed over time?
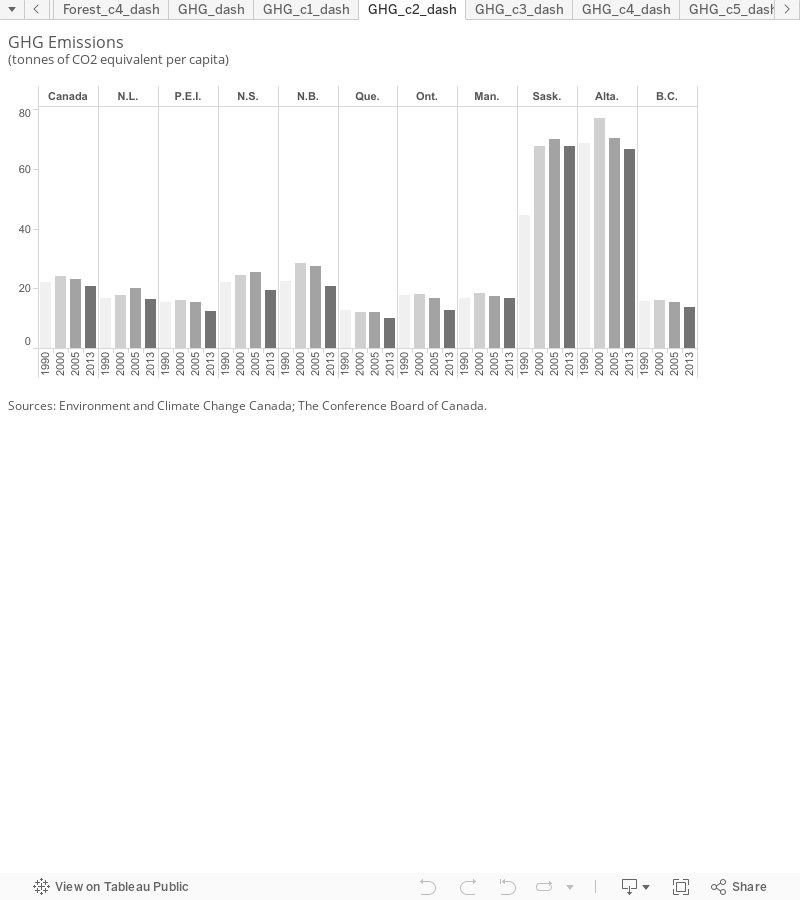
Since 1990, there have been only small changes to per capita GHG emissions in most provinces and across the country as a whole. Nationally, per capita emissions increased between 1990 and 2000 but subsequently decreased to levels below those in 1990.
Most provincial and territorial emission rates were lower in 2013 than in 1990. The only exceptions were Saskatchewan and the Northwest Territories, both of which had much higher per capita GHG emissions in 2013. In Saskatchewan, this was largely the result of the development of the oil and gas industry, which accounts for over half of the increase in total emissions between 1990 and 2000. In the Northwest Territories, the increase was a result of the separation of Nunavut in 1999. Nunavut has much lower per capita emissions than the Northwest Territories, so its exclusion from 1999 onwards makes it appear as if the Northwest Territories experienced a large increase in per capita emissions.
Overall, while Canada reduced per capita GHG emissions between 1990 and 2013, the reductions were relatively small, amounting to an average decrease of 7 per cent.
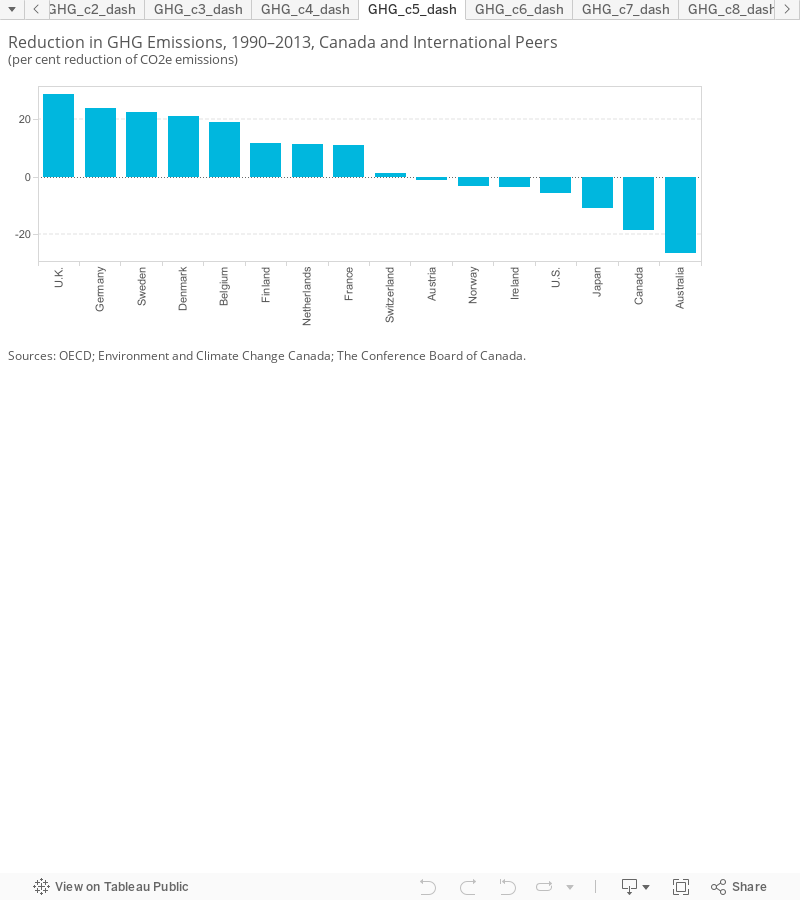
Compared with Canada’s peer countries, the emission reductions achieved by most of the provinces were relatively small. The following chart compares emission reductions to 2013.
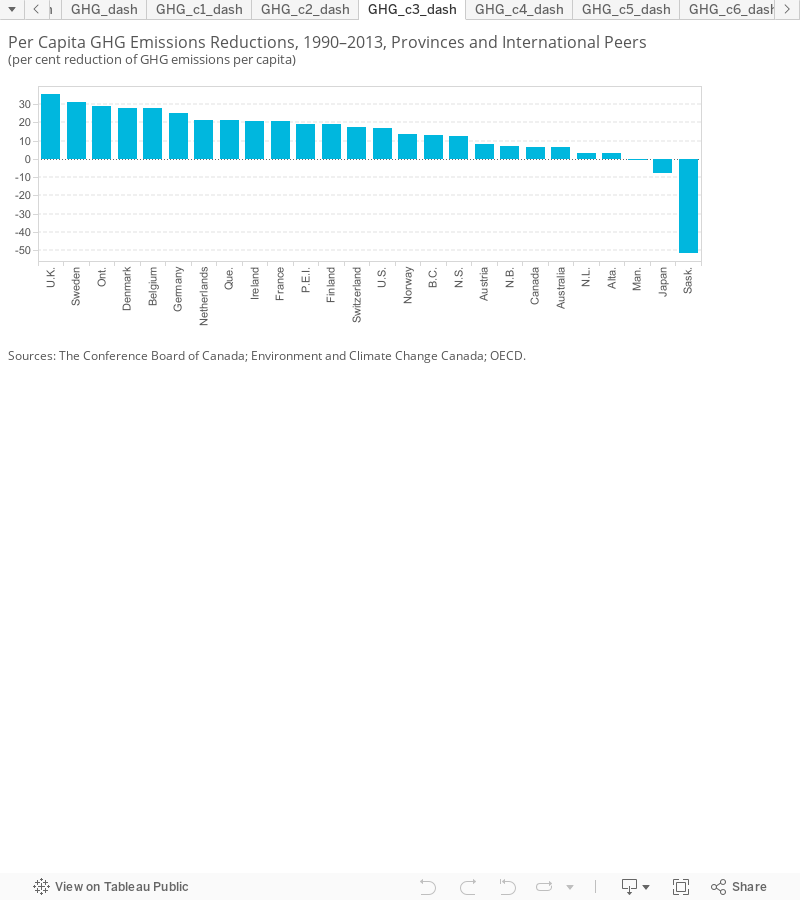
Among the provinces, Ontario made the most progress, reducing its per capita GHG emissions by 29 per cent between 1990 and 2013—the third-highest reduction in emissions of all the jurisdictions, just behind the U.K. and Sweden. Quebec also did relatively well, reducing its per capita GHG emissions by 21 per cent. The rest of the provinces, and Canada as a whole, have made middling reductions at best. Canada’s GHG emissions fell by only 7 per cent between 1990 and 2013. Saskatchewan stands out as having increased its per capita GHG emissions much more than any other jurisdiction, even Japan, the only international peer to increase per capita emissions since 1990.
Why do Saskatchewan and Alberta have such high emissions?
Both Alberta and Saskatchewan produce most of their electricity from fossil fuel combustion. In Alberta, emissions from electricity and heat generation produce roughly 47 million tonnes CO2e, only one-fifth of the province’s total emissions, but close to the total GHG emissions produced in B.C. (a province with a similar population) across all industries and households.3
High reliance on coal in particular (see low-emitting electricity production) drives high GHG emissions. Saskatchewan’s emissions from electricity production are comparably high, at 16 million tonnes CO2e, also about one-fifth of the province’s total GHG emissions.
Even more important, however, are the emissions from the mining and oil and gas industry. In Alberta, this industry emits 73 million tonnes CO2e from the consumption of fuels during energy extraction. Because of the size of this industry, there are also large amounts of fugitive emissions (released, primarily, as a by-product of natural gas processing), to the tune of 37 million tonnes CO2e. These industries contribute similarly to Saskatchewan’s high emissions.
Both provinces also have a lot of farms, which contribute to their high emissions.
In essence, the natural resources available to these provinces have driven their economies to consume high amounts of fossil fuels for their own needs and for export commodities. Because the largest industries in these provinces have high GHG emission intensities, their per capita emissions are much higher than provinces with fewer readily available fossil fuels to consume and extract.
How have total GHG emissions changed over time?
Measuring emissions on a per capita or per GDP basis allows us to examine and benchmark the emissions of each jurisdiction relative to its population. But it is the absolute amount of GHG emissions that ultimately affects the environment. An area with a high per capita emission rate but a small population (such as Saskatchewan) could produce fewer emissions than one with a lower per capita emission rate and larger population (such as Ontario).
Looking at how emissions levels have changed since 1990, we see that most European peer countries have managed to reduce their total emissions. However, several countries, including Canada, have increased their emissions since 1990. In fact, Canada has had the second highest increase in GHG emissions among the peer countries, with an increase of 18 per cent. Australia’s GHG emissions increased by nearly 27 per cent.
Part of the explanation for the large increase in Canada’s and Australia’s emissions is population growth. The average population growth across all peer countries from 1990 to 2013 was 16 per cent, and both Canada’s and Australia’s populations increased by more than this average (28 and 36 per cent, respectively). High population growth may also explain the growth in emissions from the U.S. (27 per cent population growth) and Ireland (31 per cent population growth). However, population growth does not tell the whole story. Japan, for example, experienced growth in GHG emissions of 11 per cent, despite having the second lowest population growth of only 3 per cent (behind Germany).
Regardless of the causes of GHG emissions, much needs to be done in the peer countries, as well as developing economies, to reduce emissions in order to limit global warming to 2°C, the target set by the 195 participating countries at the recent 2015 United Nations Climate Change Conference (known as “COP21”).4 This is an ambitious (albeit non-binding) target and, by one estimate, will require that global carbon emissions (CO2) due to human activity be reduced to net zero sometime between 2055 and 2070.5 Similarly, to keep global average temperatures within this 2°C limit, GHG emissions (all GHGs including CO2, CH4, N2O, and others) will have to be reduced to net zero between 2080 and 2100. This does not mean that humans must stop emitting GHGs altogether by 2080, but that any emissions must be offset by extracting an equal amount GHGs from the atmosphere.
Where do most of Canada’s GHG Emissions come from?
Most GHG emissions in Canada are a result of energy consumption.
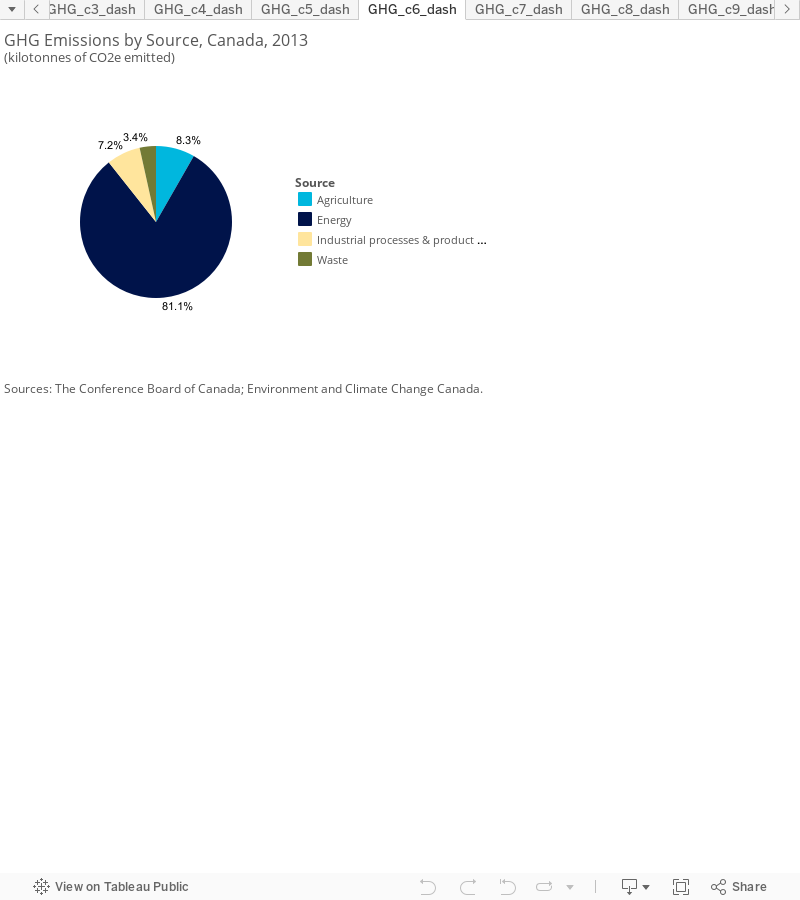
Energy production and consumption was responsible for 81 per cent of the 726 megatonnes of CO2e emitted in Canada in 2013. The remaining emissions can be divided into three other categories: agriculture, industry, and waste. GHG emissions from agriculture result from livestock digestion (primarily methane emissions from cows), animal waste, soil decomposition, and carbon-containing fertilizers.
GHG emissions from energy consumption can be further broken down into emissions from stationary combustion sources, emissions from transport, and fugitive emissions.
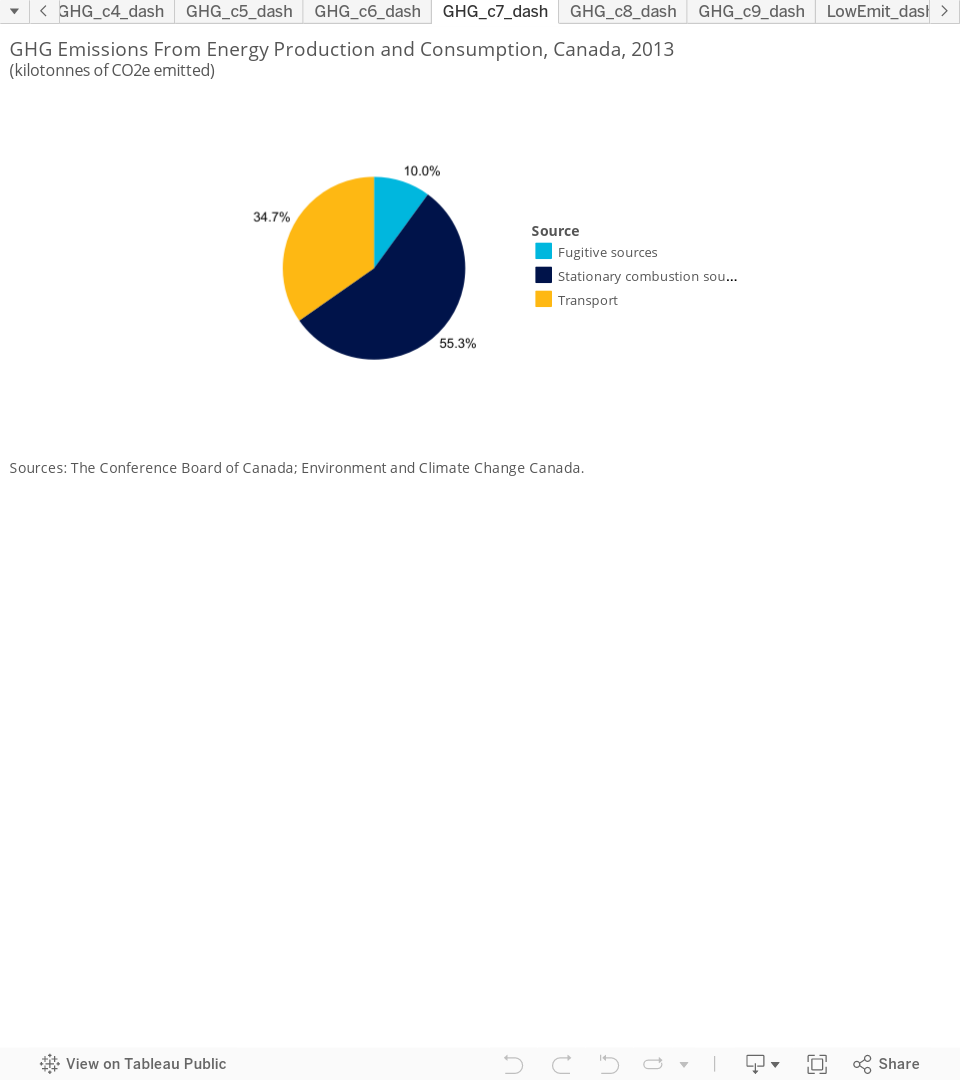
Stationary combustion sources are residences, commercial buildings, industry facilities, etc. They account for 55 per cent (325 megatonnes CO2e) of Canada’s energy combustion emissions. Transport accounts for the second largest portion, at 35 per cent of energy emissions (204 megatonnes). The remaining 10 per cent (59 megatonnes) come from fugitive sources.
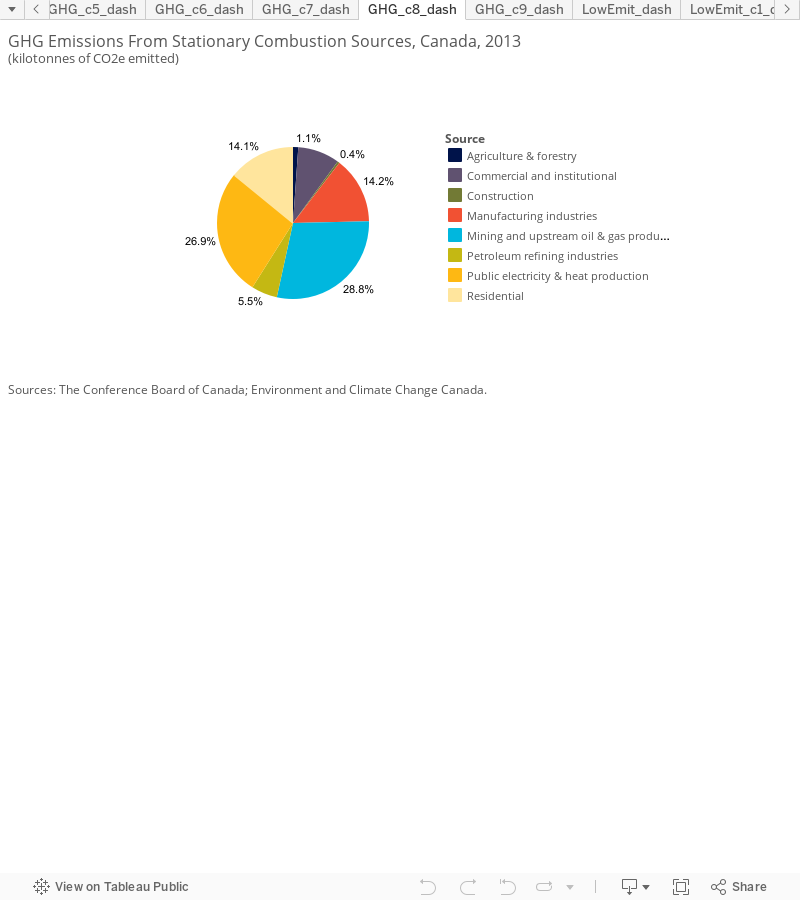
Among stationary combustion sources of GHG emissions, the largest single source is mining and upstream oil and gas production, which is responsible for over 93 megatonnes of emissions (30 per cent). Nearly equal are the emissions from electricity and heat production, at 88 megatonnes (27 per cent). Behind that, the next largest contributors are manufacturing industries and residences, each of which emit about 46 megatonnes CO2e (14 per cent each). The commercial and institutional sector produces 29 megatonnes (9 per cent). Stationary sources in construction and agriculture (that is, not trucks or tractors) collectively emit less than 2 per cent of the total GHG emissions (5 megatonnes combined).
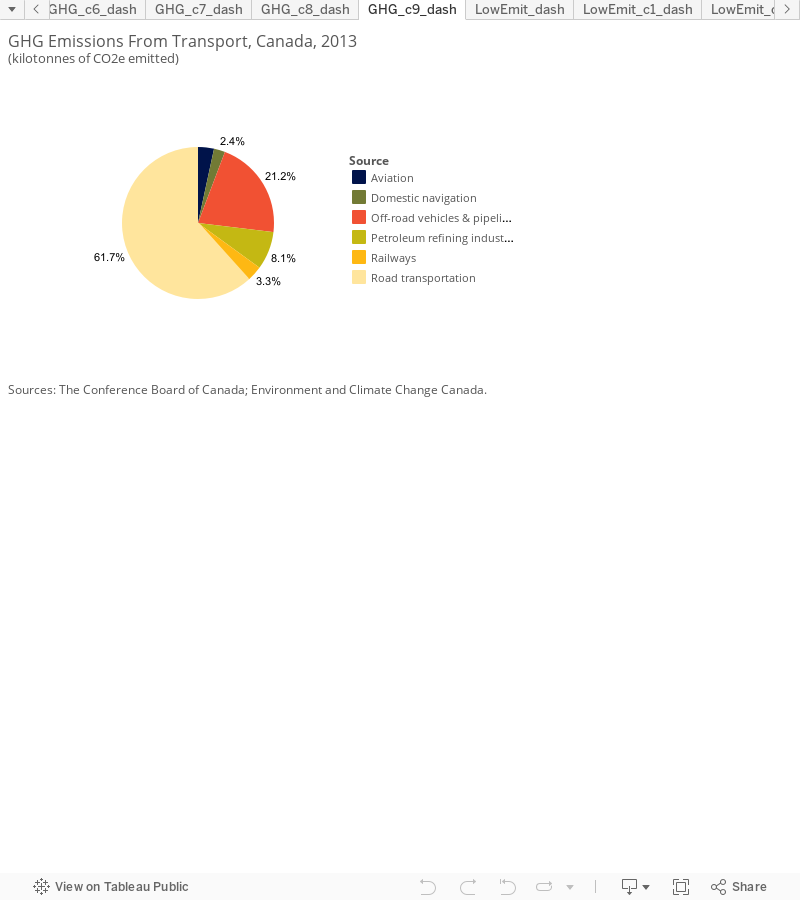
Among transportation sources, on-road vehicles are responsible for two-thirds (137 megatonnes) of transport GHG emissions. Within on-road transportation, light-duty vehicles account for 62 per cent of road vehicle GHG emissions, while heavy-duty vehicles account for 37 per cent of road vehicle GHG emissions. The remaining 1 per cent is emitted by motorcycles and vehicles that use propane or natural gas as fuels.
Off-road vehicles and pipelines emit most of the remaining transport emissions (47 megatonnes; 21 per cent). Railways, domestic navigation, and aviation each account for less than 5 per cent and collectively generated roughly 21 megatonnes CO2e in 2013.
The final category of energy consumption GHG emissions, fugitive emissions, are a by-product of oil and natural gas extraction and coal mining. Of the 58 megatonnes of fugitive emissions in 2013, 56 megatonnes (97 per cent) were from oil and gas extraction, while coal mining accounted for only 2 megatonnes (3 per cent).
What are provinces doing to reduce GHG emissions?
Several provincial governments have programs and policies in place to reduce GHG emissions. British Columbia implemented a carbon tax in 2008. A carbon tax is a tax on pollution—a fee charged to emitters based on the amount of carbon produced as a result of burning fossil fuels. B.C. has a wide-ranging tax of $30 per tonne CO2e, applied almost universally at the point of sale for fossil fuels (except for some individuals and businesses, such as farmers). Revenues from B.C.’s carbon tax go into the B.C. government’s general revenues, and the tax is made “revenue neutral” through tax breaks.
Alberta levies a fee of $15 per tonne CO2e on industrial facilities that emit more than 100,000 tonnes CO2e per year unless they reduce emission intensity by 12 per cent below an established baseline. The province uses the levied money to support GHG reduction and mitigation efforts. In November 2015, the Government of Alberta announced a plan to implement a new carbon tax that will apply economy-wide (unlike the existing carbon tax). Starting in January 2017, the province will charge a tax of $20 per tonne CO2e emitted, increasing to $30 per tonne in 2018.
Other provinces are moving to put a cap on GHG emissions. Quebec has put into place a “cap and trade” system to reduce industrial GHG emissions. Under a cap and trade system, business must meet certain emission targets, but if they do not, they are permitted to purchase carbon “credits” from other businesses that exceed their emissions targets. In tandem with California and B.C., Quebec is part of the Western Climate Initiative, an organization that provides a market for the exchange of carbon credits across businesses in the participating jurisdictions.
Ontario is planning a similar cap and trade system for GHG emissions that would likely work with the Western Climate Initiative, increasing the size and effectiveness of this market.
For a detailed analysis of the effectiveness of other federal and provincial government policies to reduce GHG emissions in Canada, see Greenhouse Gas Mitigation in Canada, Ottawa: The Conference Board of Canada, 2011.
Footnotes
1 Daniel C. Esty and others, Pilot 2006 Environmental Index (New Haven: Yale Center for Environmental Law & Policy, 2006).
2 OECD, Environment Directorate, OECD Key Environmental Indicators (Paris: OECD, 2004).
3 Environment Canada, National Inventory Report 1990–2013: Greenhouse Gas Sources and Sinks in Canada (Gatineau: Environment Canada, 2015).
4 United Nations Framework Convention on Climate Change, Adoption of the Paris Agreement, 22.
5 United Nations Environment Programme, The Emissions Gap Report 2014 (Nairobi: UNEP, 2014) XV.