
Infant Mortality
Key Messages
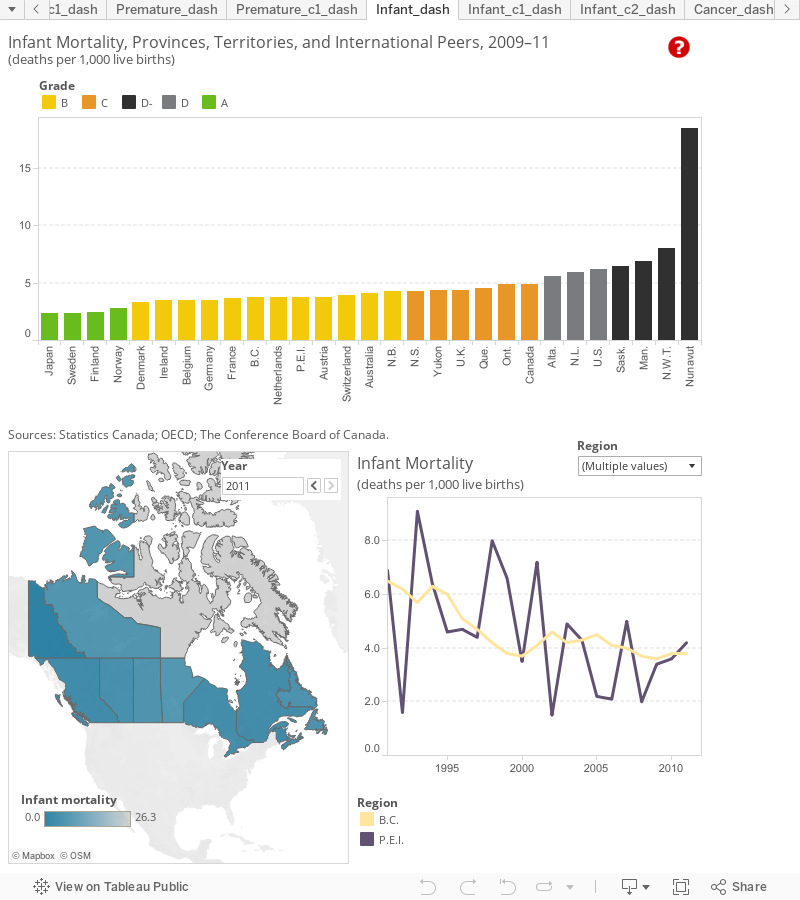
- B.C. and P.E.I. score “B” grades and are the top-ranked provinces, with the lowest infant mortality rates in Canada between 2009 and 2011.
- Alberta and Newfoundland and Labrador score “D” grades, while Saskatchewan, Manitoba, the Northwest Territories, and Nunavut all get a “D–” with infant mortality rates higher than that of the worst-ranked peer country, the United States.
- With an average of 18.5 deaths per 1,000 live births between 2009 and 2011, Nunavut’s average infant mortality rate is over three times higher than the national average.
Putting infant mortality in context
“The infant mortality rate—the rate at which babies of less than one year of age die—reflects economic and social conditions for the health of mothers and newborns, as well as the effectiveness of health systems,” states the OECD Factbook 2009.1 Many health experts see the infant mortality rate as a sentinel indicator of child health and the well-being of a society over time. Indeed, infant mortality “is an important measure of the well-being of infants, children, and pregnant women because it is associated with a variety of factors, such as maternal health, quality and access to medical care, socioeconomic conditions, and public health practices.”2
Infant mortality also indicates health disparities between different populations, both within and between countries. The United Nations’ Human Development Report 2005 states: “No indicator captures the divergence in human development opportunity more powerfully than child mortality.”3 Infant mortality is often used as an indicator to measure the health and well-being of a nation, because factors affecting the health of entire populations can also affect the mortality rate of infants.4
How do the provinces and territories rank relative to Canada’s international peers?
Of the 16 peer countries in this report card, 12 have an average infant mortality rate below 4. Japan, Sweden, Finland, and Norway all have three-year average infant mortality rates of under 3 deaths per 1,000 live births. P.E.I. and B.C. are the only provinces that rank on par with most of Canada’s international peers, as average infant mortality rates in both provinces are 3.7 deaths per 1,000 live births. Both provinces score “B” grades, as does New Brunswick, where the average infant mortality rate between 2009 and 2011 was 4.2 deaths per 1,000 live births.
Overall, Canada’s average infant mortality rate of 4.9 is significantly higher than the three-year average rate in almost all its peer countries. Canada earns a “C” on this indicator. The only comparator country with a worse record on infant mortality is the U.S., with a three-year average of 6.2 infant deaths per 1,000 live births.
Four provinces rank below the Canadian average on infant mortality—Alberta, Newfoundland and Labrador, Manitoba, and Saskatchewan. Manitoba and Saskatchewan are the only two provinces to score “D-” grades, for ranking worse than the U.S. on infant mortality. N.W.T. and Nunavut also score “D-” grades on infant mortality, ranking at the bottom of the pack.
How do the provinces and territories perform relative to each other?
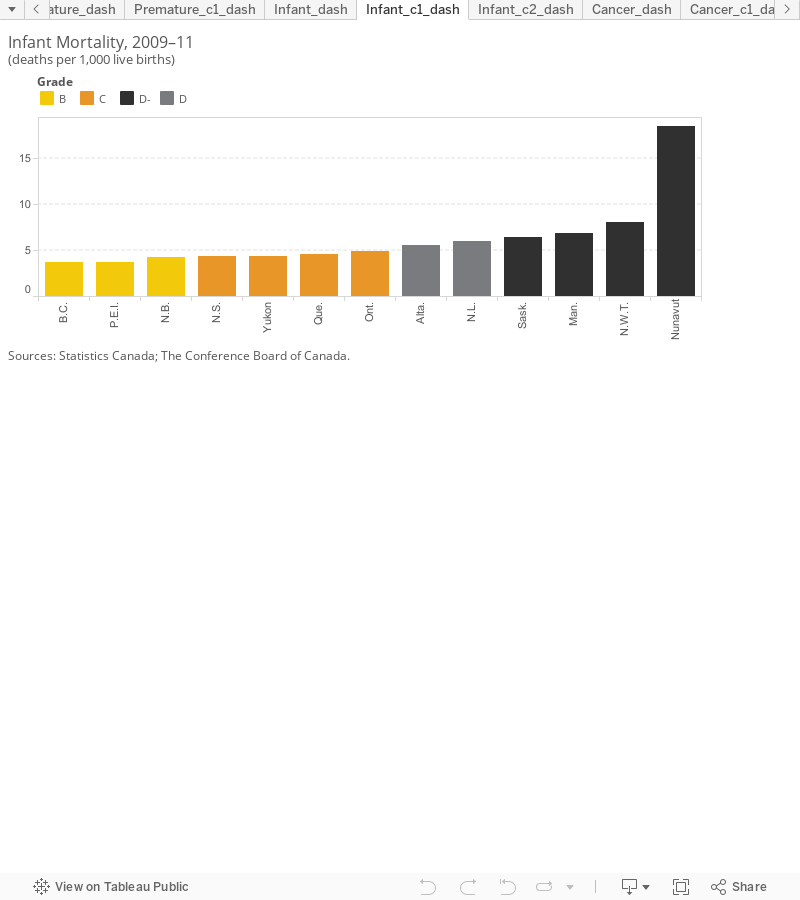
P.E.I. and B.C. are the only two provinces in Canada with an average infant mortality rate below 4 deaths per 1,000 live births. A total of six provinces and Yukon have infant mortality rates below the national average. Alberta and Newfoundland and Labrador have average infant mortality rates higher than 5 deaths per 1,000 live births, while Saskatchewan and Manitoba, the worst-ranking provinces, have average rates above 6 deaths per 1,000 live births. N.W.T. and Nunavut rank at the bottom. Nunavut is an outlier on infant mortality, with an average rate of 18.5 deaths per 1,000 live births between 2009 and 2011.
Why is infant mortality in Nunavut and N.W.T. so high?
The infant mortality rates in the Northwest Territories and Nunavut are well above the Canadian average. In fact, Nunavut’s three-year average rate of 18.5 deaths per 1,000 live births is much higher than second-to-last-place N.W.T.’s average infant mortality rate of 8. One of the leading causes of infant mortality in Nunavut is sudden infant death syndrome (SIDS), most notably from infants not sleeping on their back or from bed-sharing.5 Among Inuit communities (which represent the largest share of Nunavut’s population), SIDS is the leading cause of infant death, but other causes include congenital anomalies, infection, and conditions associated with low-birth-weight and preterm babies, such as underdeveloped organs.6 Some of these deaths are preventable—programs that educate mothers on proper sleep methods for infants, as well as increased awareness of the dangers of smoking during pregnancy, would help. Maternal smoking is more prevalent among Inuit women and increases the risk of SIDS, preterm birth, and postnatal infection. Teenage pregnancies are also associated with higher rates of infant mortality, and Nunavut far exceeds the national average of pregnancies for women under 20 years of age.7
How have the provinces performed over the past 20 years?
Infant mortality rates have trended downward in all provinces except Manitoba. In 1991, Nova Scotia posted the lowest rate, at 5.7 deaths per 1,000 live births, while Newfoundland and Labrador and Saskatchewan posted the highest rates, at 7.8 and 8.2, respectively. Since the early 1990s, New Brunswick and P.E.I. have improved significantly, as they both overtook Nova Scotia and posted the lowest infant mortality rates in the country in 2011. Nova Scotia ranked sixth on infant mortality in 2011 among the provinces, with B.C., Quebec, and Ontario all recording lower rates. Saskatchewan and Newfoundland and Labrador continue to have among the highest provincial infant mortality rates, and they have been joined by Manitoba—the only province whose infant mortality rate was worse in 2011 than in 1991.
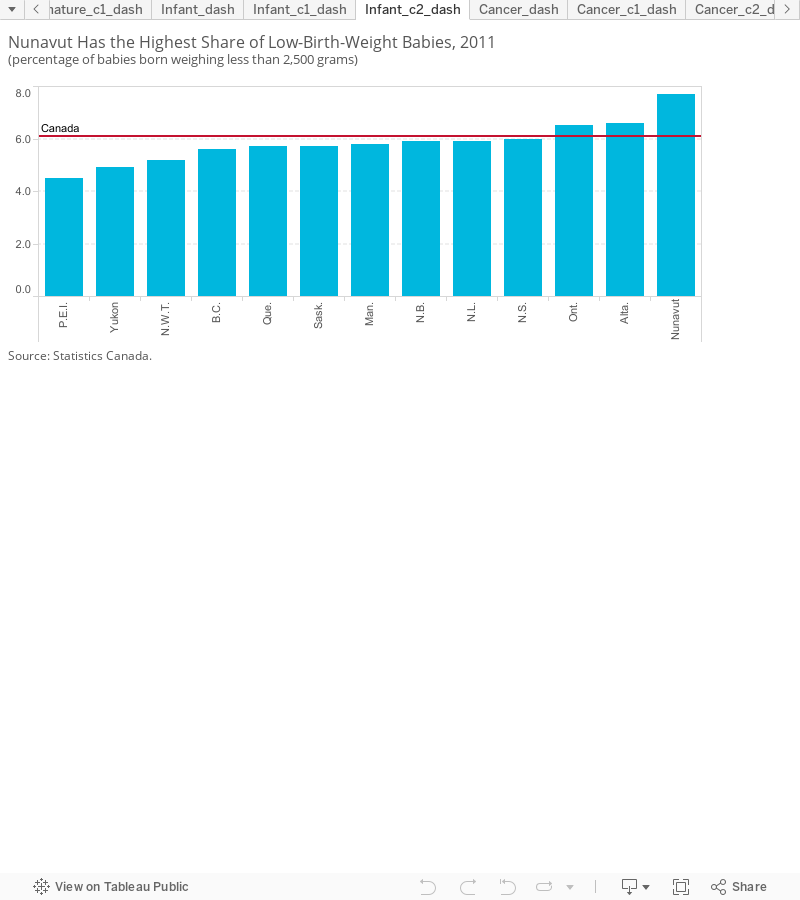
Does birth weight help explain the difference in infant mortality rates among the provinces and territories?
An infant of low birth weight remains at a much higher risk of mortality than an infant of normal weight, but other factors also affect infant mortality rates. P.E.I. and B.C. have the lowest infant mortality rates and the lowest shares of low-birth-weight babies among the provinces. After that, however, the similarities end. Saskatchewan and Manitoba are at the bottom of the pack on infant mortality, yet rank fourth and fifth among the provinces on low birth weight. Similarly, Alberta and Ontario, which place in the middle of the pack on infant mortality, have the highest shares of low-birth-weight babies among the provinces.
In Saskatchewan and Manitoba, the higher infant mortality rates are likely due to the higher share of Aboriginal populations in these two provinces. The Centre for Research on Inner City Health reports that while the rate of low-birth-weight babies is more or less similar between Aboriginal and non-Aboriginal people, higher rates of preterm birth, lower breastfeeding rates, and more occurrences of SIDS among Aboriginal populations may explain higher infant mortality rates in those provinces.8 The same explanation may hold for N.W.T., where the rate of infant mortality is high, yet the incidence of low-birth-weight babies is not.
Conversely, Yukon’s impressively low rate of low-birth-weight babies is reflected in its low infant mortality score, while higher incidence of low-birth-weight babies might help account for the higher infant mortality rate in Nunavut. Nunavut is the only territory where the share of low-birth-weight babies is higher than the Canadian average. Yukon at 4.9 per cent and N.W.T. at 5.2 per cent do better than every province except P.E.I.
Why do Canada and most of the provinces rank so low on infant mortality?
Part of difference between Canada, its provinces, and its international peers may lie in international differences in the registration of babies with an extremely low birth weight and those who do not survive the first 24 hours after birth. Some researchers suggest that comparisons between countries should therefore be interpreted with caution.9 Any discrepancy between countries can lead to under-reporting of infant deaths, particularly when compared with countries that use a broader definition for live birth. And now that infant mortality rates are so much lower than they were in the past, differences in registration may be more important in explaining inter-country differences in infant mortality.
But there is more to it than differences in registration. Socio-economic and environmental determinants of maternal and child health, as well as health-system factors such as the use of new technologies may explain Canada’s relatively high infant mortality rate. For instance, the percentage of preterm and low-birth-weight babies has been on the rise, as has the incidence of multiple births, increasing the risk of infant mortality.10 As well, the proportion of mothers over the age of 40 has gone up in recent years, and the likelihood of a low-birth-weight baby is more common among older women.11 Finally, progress in perinatal care may have actually led to proportionally more low-weight live births.12
The greater number of low-birth-weight and preterm babies, coupled with the discrepancies among countries in defining “live births,” could be contributing to Canada’s relatively higher rate of infant mortality. These medical and methodological factors undoubtedly play a role in Canada’s infant mortality rate. But how much of a role? In 2011, Canada finally fell below the rate of 5 deaths per 1,000 live births, coming in at 4.8. However, 14 peer countries have seen rates below 5 deaths per 1,000 live births for a number of years, suggesting that further attention must be paid to better understanding international differences in infant mortality rates—whether they are due to methodological or socio-economic factors, or both.
Footnotes
1 Organisation for Economic Co-operation and Development, OECD Factbook 2009: Economic, Environmental and Social Statistics (Paris: OECD, 2009), 246.
2 MedicineNet.com (accessed September 29, 2014).
3 United Nations, Human Development Report 2005 (New York: UNDP, 2005), 4.
4 Centers for Disease Control and Prevention, Infant Mortality (accessed September 29, 2014).
5 Sorcha A. Collins, Pamela Surmala, Geraldine Osborne, et al., “Causes and Risk Factors for Infant Mortality in Nunavut, Canada 1999–2011,” BMC Pediatrics 12, no. 190 (2012).
6 Zhong-Cheng Luo, Sacha Senécal, Fabienne Simonet, et al., “Birth Outcomes in the Inuit-Inhabited Areas of Canada,” CMAJ, 182 no. 3, (February 23, 2010).
7 Statistics Canada, CANSIM, table 106-9002, Pregnancy Outcomes, by Age Group, Canada, Provinces, and Territories (accessed September 29, 2014).
8 Centre for Research on Inner City Health, Indigenous Children’s Health Report: Health Assessment in Action (Toronto: CRICH, 2009), 30.
9 K.S. Joseph, Shiliang Liu, Jocelyn Rouleau, et. al., “Influence of Definition Based Versus Pragmatic Birth Registration on International Comparisons of Perinatal and Infant Mortality: Population Based Retrospective Study,” The BMJ (February 2012).
10 Nora Bohnert, Mortality: Overview, 2008 and 2009 (Ottawa: Statistics Canada, July 2013).
11 Ibid.
12 Ibid.