
Water Quality Index

Stay up to date
Looking for the latest in sustainability planning? Create a CBoC account and sign up for email updates.
Key Messages
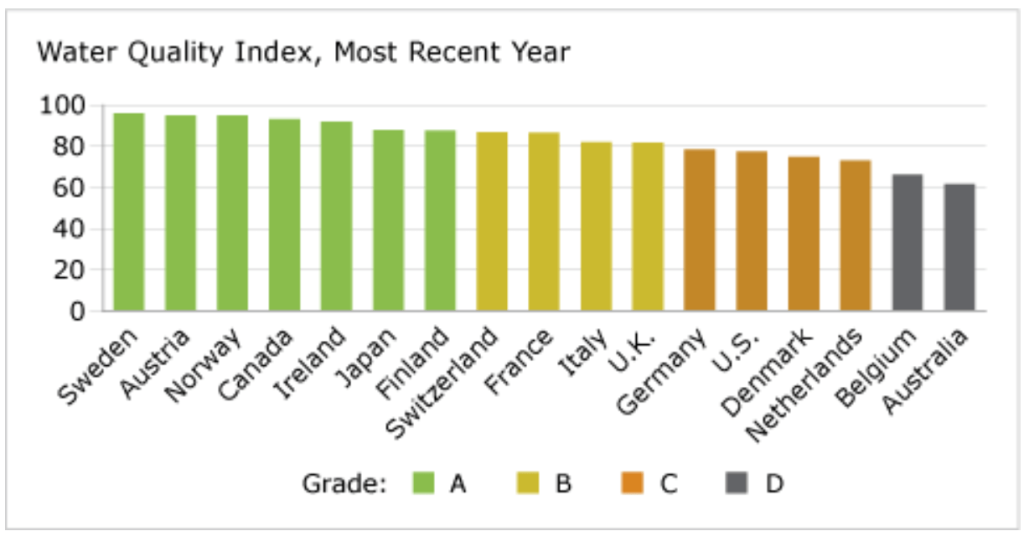
- Canada earns an “A” grade on water quality and ranks 4th out of 17 countries.
- Canada’s water quality is most affected by industrial effluent, agricultural runoff, and municipal sewage pollution.
- Increases in toxic algal blooms in Canadian lakes and coastal water have heightened risks to human health.
Putting water quality in context
The health and well-being of humans and ecosystems depend heavily on the quality of the water resources available. Water is necessary for all biological life. It also supports global food production by providing the fundamental resource upon which agriculture, livestock production, fisheries, and aquaculture depend. Water is also crucial for industrial activity and municipal services.1
The main concerns with water quality are the impacts of water pollution (eutrophication, acidification, and toxic contamination) on human health, on the cost of drinking water treatment, and on ecosystems. New waste-water treatment facilities have helped. But pollution from agricultural sources is an issue in many countries, as is the supply of safe drinking water. Policies that promote good water quality are critical to protect aquatic biodiversity and drinking water sources.
How does Canada’s water quality compare to that of its peer countries?
Canada ranks 4th out of 17 peer OECD counties for water quality and receives an “A” grade for performance. Two Scandinavian countries—Sweden and Norway—together with Austria rank ahead of Canada. Two countries receive “D”s for their overall water quality.
What is putting stress on water quality in Canada?
Canada’s water quality is at risk from poorly treated municipal waste, industrial effluent, and fertilizer run-off from agriculture. Most of the nitrogen and phosphorus released into the environment comes from these three sources. Although toxic effluents are heavily regulated in Canada, release of nutrients into the watershed is common.
Phosphorus and nitrogen are important nutrients in fresh water, but high concentrations can lead to eutrophication—when an excess of nutrients overstimulates plant growth and decreases oxygen supplies, making the water unusable. Eutrophication is a serious water quality issue for the Prairie provinces, southern Ontario, and Quebec.2 In southern Ontario, nitrogen and phosphorus released from agriculture, municipal sewage, and industrial waste water have hurt the water quality of the Great Lakes and other inland waters. In the Prairies, nutrient concentrations are naturally high in rivers, and intensive agriculture magnifies the problem.
British Columbia has fewer eutrophication problems than other provinces. But its heavily populated lower Fraser River Basin has high levels of agricultural runoff and municipal waste-water discharge, resulting in nutrient enrichment. An estimated 90 per cent of the province’s municipal waste water is discharged into the lower Fraser River or its tributaries.3
What has the biggest impact on Canada’s water quality?
Municipal waste-water discharges are one of the largest sources of pollution in Canadian waters. In 2006, municipal waste-water effluents produced by households, businesses, and industries generated 84 per cent of the water effluents reported under the National Pollutant Release Inventory.4 Municipal waste water is composed of sanitary sewage and storm water, and can contain grit, debris, suspended solids, disease-causing pathogens, decaying organic wastes, nutrients, and about 200 identified chemicals.
What is Canada doing to reduce municipal waste-water discharges?
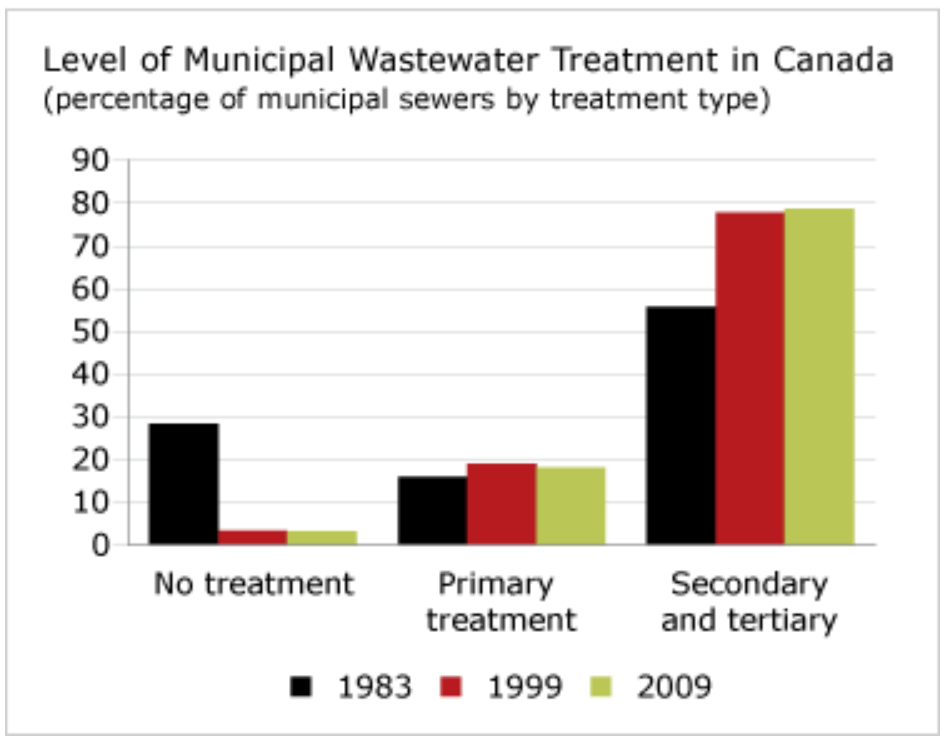
Overall, the percentage of Canadians served by waste-water treatment has been increasing. Combined secondary5 and tertiary6 waste-water treatment was provided to 78 per cent of the population in 1999, up from 56 per cent in 1983. By 2009, 79 per cent of the population was served by water treatment.
Sewage treatment varies greatly across Canada, but it is generally improving as more municipalities upgrade their treatment facilities.
Should Canadians be more concerned that Canada is not a leader on water quality?
Increases in toxic algal blooms in Canadian lakes and coastal water have increased risks to human health. There has also been an increase in the frequency and spatial extent to which the drinking water guideline for nitrate has been exceeded in groundwater across Canada.7
Environmental problems caused by excessive nutrients are less severe in Canada, however, than in many countries with a longer history of settlement and agricultural production. Canadian governments have also regulated waste-water discharges from industrial and municipal sewage treatment plants over the last 30 years. And as new information and technologies have become available, measures for addressing excessive nutrient loadings have been refined. Still, environmental and human health problems related to nutrients are evident across Canada.
Is Canada’s water quality improving?
Overall, Canada’s water quality is better today than it was 30 years ago. But although phosphorous discharge decreased in the 1980s and 1990s, there was simultaneous increase in nitrogen discharge. In 1999, 82,750 tonnes of total nitrogen (i.e., nitrogen in all its chemical forms) were released to surface waters in Canada through municipal waste-water discharges—a 24 per cent rise over 1983 levels. Phosphorus, on the other hand, decreased by 44 per cent, with 4,950 tonnes of total phosphorus released to surface waters from municipal waste-water treatment plants in 1999.
But phosphorus levels have been on the rise once again. In 2006, phosphorus releases increased to 6,874 tonnes.8 Although nitrogen releases have decreased since 1999—down to 52,702 tonnes in 2006—elevated concentrations of these nutrients remain a critical water quality issue in Canada.
What is being done to monitor water quality in Canada?
Environment Canada puts together data on the quality of freshwater at 173 monitoring stations in rivers in populated areas across the country, using the Canadian Council of Ministers of the Environment’s water quality index. From 2007 to 2009, freshwater quality was rated poor or marginal in 16 per cent of the stations, fair in 41 per cent, good in 33 per cent, and excellent in 10 per cent—slightly better than in the previous three-year period.9
What does the Water Quality Index stand for?
The Water Quality Index, developed by the Yale Center for Environmental Law & Policy, is one of the indicators that make up the Environmental Performance Index. It is a proximity-to-target composite of water quality, adjusted for the density of monitoring stations in each country, with a maximum score of 100.
The Water Quality Index measures dissolved oxygen, pH, conductivity, total nitrogen, and total phosphorus. It is an indicator of eutrophication, nutrient pollution, acidification, and salinization. More specifically, it measures the following:10
- Dissolved oxygen is a measure of free (i.e., not chemically combined) oxygen dissolved in water. It is essential to the metabolism of all aerobic aquatic organisms. Reduced levels have been shown to harm and even kill plants and fish.
- pH is a measure of the acidity or alkalinity of a water body. It can affect aquatic organisms both directly, by impairing respiration, growth, and development of fish, and indirectly, by increasing the bioavailability of certain metals such as aluminum and nickel.
- Conductivity is a measure of the ability of water to carry an electric current, which depends on the presence of ions. Increases in conductivity can lead to changes that reduce biodiversity and alter community composition.
- Nitrogen and phosphorus are naturally occurring elements essential for all living organisms. But they are often found in growth-limiting concentrations in aquatic environments. Increases in nitrogen or phosphorus in natural waters, largely as a result of human activities in the drainage basin (e.g., from agricultural runoff from manure and synthetic fertilizers, and from municipal and industrial waste-water discharge), can overstimulate plant growth and choke off oxygen supplies.
Footnotes
1 Daniel C. Esty et. al., Pilot 2006 Environmental Index (New Haven: Yale Center for Environmental Law & Policy, 2006).
2 Indicators and Assessment Office, Ecosystem Science Directorate, and Environmental Conservation Service, Environment Canada, Nutrients in the Canadian Environment, Reporting on the State of Canada’s Environment (Ottawa: Environment Canada).
3 Indicators and Assessment Office, Ecosystem Science Directorate, and Environmental Conservation Service, Environment Canada, Nutrients in the Canadian Environment, Reporting on the State of Canada’s Environment (Ottawa: Environment Canada).
4 Environment Canada, National Pollutant Release Inventory, November 8, 2007 (accessed August 19, 2008).
5 Secondary treatment is the use of biological processes to break down organic material and remove additional suspended solids.
6 Tertiary treatment is an advanced treatment that uses additional filtering or chemical or biological processes to remove specific compounds or materials that remain after secondary treatment.
7 Indicators and Assessment Office, Ecosystem Science Directorate, and Environmental Conservation Service, Environment Canada, Nutrients in the Canadian Environment, Reporting on the State of Canada’s Environment (Ottawa: Environment Canada, n.d.), p. 14.
8 Environment Canada, National Pollutant Release Inventory, November 8, 2007 (accessed August 19, 2008).
9 Environment Canada, “Freshwater Quality in Canadian Rivers” (accessed November 22, 2012).
10 Yale Center for Environmental Law and Policy, 2010 Environmental Performance Index: Water Quality Index 2010 (accessed November 12, 2012).