
Unemployment Rate
Key Messages
- Unemployment rates in some Western provinces are comparable to rates in some of the top-performing developed economies in the world.
- P.E.I. and Newfoundland and Labrador rank among the weakest performers in the peer group.
- The unemployment rate is lower for women than for men in all provinces except Saskatchewan.
Putting the unemployment rate in context
During the 2008–09 recession, Canada’s unemployment rate peaked at 8.3 per cent. The Canadian economy was lucky to avoid much of the job loss carnage in the U.S. and the eurozone, and Canada’s solid financial sector and fiscal position helped it be among the world leaders on this measure in the years following the crisis.
But in recent years, Canada has failed to keep pace with the progress in other countries, partly because of the impact of the negative commodity shock that hit in 2014 and the lingering fallout still being felt in 2016. This is reflected in Canada’s C grade for 2016. The country’s 7.0 per cent unemployment rate in 2016 was in the bottom third of the developed countries examined in How Canada Performs. Still, Canada’s recent slip in the rankings is better than the situation in the 1970s and early 1980s, when Canada routinely got Ds because job creation did not keep pace with the rapidly growing workforce.
Some peer countries, such as Finland and France, continue to record very high unemployment rates as they struggle with the lingering effects of the 2008–09 financial crisis and recession, as well as the European fiscal crisis of 2010–13.
Many other countries, though, have done a better job of making progress on employment than Canada has. In the U.S., the unemployment rate during the recession was well above Canada’s, peaking at 9.6 per cent. But unemployment there has since fallen to just 4.9 per cent, well below Canada’s rate.
At the far end of the spectrum, Japan managed an unemployment rate of just 3.1 per cent in 2016, lower than any of the other peer countries. Despite suffering from a recession last year, a number of unique factors—like falling real wages1—meant Japan still had an unemployment rate lower than Canada has ever experienced.
How do the provinces rank on unemployment relative to Canada’s peer countries?
Provincial unemployment rates vary significantly. Some of the Western provinces have unemployment rates that are close to those of the top-performing countries, such as Norway. Saskatchewan, Alberta, and Manitoba all score “A” grades on this indicator. But unemployment rates in Atlantic Canada are as high as those in struggling eurozone countries, including France and Ireland. Newfoundland and Labrador and P.E.I. are both “D” grade performers, in the company of Ireland, the only peer country to score a “D.”
How is the tepid economic recovery affecting unemployment in the provinces?
Just as the recovery from the 2008−09 recession has differed sharply among developed countries, Canada’s provinces have also experienced different outcomes. The unemployment rate increased during the 2008–09 recession in all provinces. Even in Alberta, Canada’s top-performing economy in recent years, the unemployment rate increased from 3.5 per cent in 2007 to 6.6 per cent in 2009. The unemployment rate in Atlantic Canada, which was already at double-digit levels before the recession, soared even higher as a result of the contraction in demand.
The recovery in demand and employment has benefited most, but certainly not all, of Canada’s provinces. The unemployment rate in Alberta declined to 4.6 per cent in 2013. Ontario’s unemployment rate dropped from 9 per cent in 2009 to 7.5 per cent in 2013. Unfortunately, Nova Scotia’s unemployment rate has barely budged (9.3 per cent in 2010 versus 9 per cent in 2013), and the rate in New Brunswick has actually increased, to 10.4 per cent from 8.8 per cent in 2007. Both provinces have been hampered by the sluggish U.S. recovery that has hurt export demand. For example, exports of forestry products have stayed in a slump because of the weak recovery in U.S. housing markets—a recovery that only started to gain traction in 2013. Nova Scotia and New Brunswick also had very weak domestic economies in recent years.
How do the provinces’ perform relative to one another?
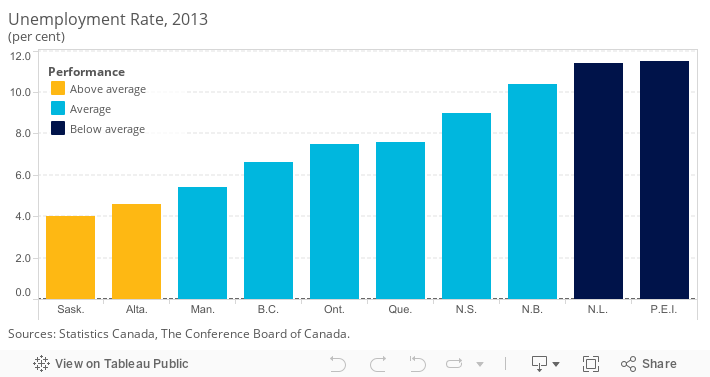
In addition to ranking the provinces against Canada’s international peers, the provinces have been compared with each other and placed into three categories: “above average,” “average,” and “below average.”1 The unemployment rate varies sharply among Canada’s provinces. In general, provinces in Western Canada have far lower unemployment rates than in the rest of the country. Both Saskatchewan and Alberta are above average performers on this indicator. Saskatchewan’s unemployment rate was 4 per cent in 2013, lower than the national average of 7.1 per cent and significantly below the double-digit rates in P.E.I., Newfoundland and Labrador, and New Brunswick.
Differing unemployment rates among the provinces generally reflect developments in the global economy—a crucial factor given Canada’s huge dependence on international trade. Western provinces—especially Saskatchewan and Alberta—have benefited from strong commodity prices in recent years, particularly for oil and agricultural products. Although the recession led to a slump in prices for commodities such as oil, they recovered quickly mainly because the Chinese economy continued to grow at a strong pace both during and after the 2008–09 recession. High commodity prices have boosted incomes and economic growth in Western Canada, helping to lower unemployment rates. British Columbia’s unemployment rate remains above the other Western provinces’ because its key forestry sector has been hurt by the damage inflicted by the pine beetle and by the slump in the U.S. housing market.
Unemployment rates in Ontario and Quebec remain above the Canada-wide average and are sharply higher than in Western Canada. These two provinces are going through structural changes in the manufacturing sector and do not have the same reliance on the resources sector as the Western provinces. Consequently, economic growth has been weaker and unemployment rates higher. Manufacturers exporting to the key U.S. market in particular were hurt by the sluggish recovery in the U.S. economy and by the higher value of the loonie.
Why is Atlantic Canada’s unemployment rate so high?
The unemployment rate for three of the four Atlantic provinces remained in double-digits in 2013. Newfoundland and Labrador has generally performed better thanks to its resources sector. The Atlantic provinces have been burdened by excess production capacity, as they have not benefited from the boom in commodity demand over the past decade or so. Manufacturers in these provinces also did not benefit from the ripple effect of high growth in the U.S. economy and the weak Canadian dollar—two key factors that boosted economic growth in Ontario and Quebec.
How do the territories rank on unemployment?
Compared with international peers, Yukon earns an “A” grade, the Northwest Territories a “B,” and Nunavut a “D.” At 13.5 percent, Nunavut’s unemployment rate is higher than all international peers except Ireland and above that of all provinces and territories. The high rate is striking given that employment growth over the past seven years has been robust. Two key factors are contributing to the high unemployment rate:
- Many of the available jobs are filled by relatively higher-skilled workers from the south who do not take up residency in the territories and are therefore not counted in territorial employment statistics.
- The increase in jobs due to economic expansion has encouraged more Nunavummiut to enter the labour force and search for jobs. As the labour force expands, and not all the new entrants find jobs (many Nunavummiut do not have the right skills to work in the mining or construction sectors), the number of unemployed (which counts the number of people in the labour force without a job) increases, thereby pushing the unemployment rate up.
Conversely, Yukon had a relatively low unemployment rate in 2013, 5.4 per cent. The unemployment rate in the Northwest Territories was 8.2 per cent—higher than those of the six provinces west of Atlantic Canada.
Labour markets in the territories are expected to perform well over the next year or so, thanks to the development of new mines and strong construction activity.
The territories are not included in the overall provincial and international benchmarking calculations because data are not available for many of the indicators included in the six main report card categories. The Conference Board is, however, committed to including the territories in our analysis, and so we produce separate territorial report cards when data are available, such as for the unemployment rate.
The Conference Board of Canada produces a biannual Territorial Outlook report that examines the economic and fiscal outlook for each of the territories, including output by industry, labour market conditions, and the demographic make-up of each territory. The Territorial Outlook can be accessed online at our e-Library and for clients subscribing to e-Data.
Research on issues affecting the territories is also produced by the Centre for the North, a Conference Board initiative that began in 2009.
Should provinces aim for zero unemployment?
The ultimate goal of employment policy should be that all Canadians who want to work, and are able to work, should be able to find a job, no matter which province they live in. Unemployment, especially on a repeated or prolonged basis, has corroding consequences for individuals, their families, and the communities in which they live.
However, “full employment” in economic terms does not necessary mean zero unemployment—even for a booming province such as Alberta. Rather, it is the lowest possible unemployment rate without igniting inflation, with the economy growing and all factors of production being used efficiently. There will always be unemployment caused by mobility within the labour force—people moving between jobs, switching careers, or relocating geographically. Canadians are constantly moving to different provinces to take advantage of better job opportunities. Throughout much of the 1990s and early 2000s, Ontario’s manufacturers attracted workers from not only Atlantic Canada but some Western provinces. More recently, workers have packed up and moved from provinces in Eastern Canada, including Ontario, to the West for better job prospects.
Structural shifts in the economy—often the result of technological change—also contribute to some level of unemployment. When, for example, the introduction of computer desktop publishing led to the elimination of traditional typesetting, typesetters lost their jobs. Some were able to retrain for other jobs, but others found themselves chronically unemployed or underemployed. The only way a country could ever eliminate this type of unemployment is by eliminating all technological advancement that results in structural shifts. Obviously, no country should aspire to this.
Does low unemployment ensure a stronger economy?
Not necessarily. Countries with extremely low unemployment rates often face labour shortages, wage cost pressures, and other problems. Labour shortages can severely constrain a country’s economic growth and its productive capacity.
Alberta and Saskatchewan are having difficulties finding enough qualified workers for the expansion of their resource sectors, something that has limited production. Tight labour markets put upward pressure on wages, a development that could potentially limit the profitability and available cash flow of resource companies in Western Canada. Real estate prices can soar as a result of rising interprovincial migration, and concerns can arise about property market bubbles.
Are there differences in the unemployment rate between men and women in Canada and the provinces?
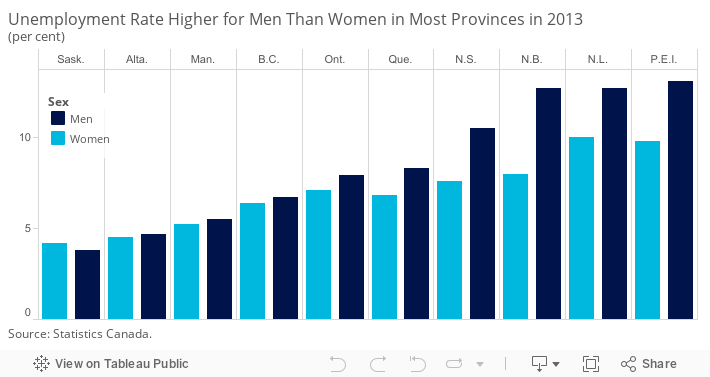
Canada’s unemployment rate was 6.6 per cent for women in 2013 and 7.5 per cent for men. Except for Saskatchewan, all provinces had a lower female than male unemployment rate in 2013. This trend has actually been in place in Canada for a few decades. Between 1976 and 1981, the unemployment rate for men was lower than the rate for women, but this trend has gradually reversed in the decades following 1981. The change reflects structural adjustments in the Canadian economy. Employment in male-dominated manufacturing has declined, because globalization has resulted in job losses in many manufacturing sectors. At the same time, employment in Canada’s services sector has increased sharply, especially in female-dominated areas, including health care and education.
The divergence in unemployment rates between men and women is especially evident in the Atlantic provinces. The unemployment rate in New Brunswick was 12.7 per cent for men in 2013 versus 8 per cent for women—a difference of 4.7 percentage points. Male-dominated industries such as fisheries and forestry have been hurt by the global recession and its lingering effects. In the case of the fisheries, a decline in fish stocks in the Atlantic has taken its toll on the industry.
Are the trends in unemployment rates for the provinces likely to continue?
The short answer to this question is yes—provinces in Western Canada will continue to record lower unemployment rates than the rest of Canada over the coming years. However, the magnitude of the difference could change as a result of recent developments in the global economy and an improvement in economic growth in Central and Atlantic Canada. The boom in commodity prices that has benefited labour markets in Western Canada will moderate. Technological change in the oil industry, such as fracking, has increased the supply of oil, and as a result, world oil prices are unlikely to surge toward the US$200 per barrel mark that some economists predicted a few years ago. This implies that the divergence between unemployment rates in the West and other regions of the country could narrow.
At the same time, the unemployment rate for Canada’s central provinces, Ontario and Quebec, should improve over the next year or two thanks to the rebound in the U.S. economy, a weaker Canadian dollar, and a general improvement in their domestic economies.
Footnotes
1 To compare the performance of Canadian provinces relative to one another, we first determined the average score and standard deviation of the provincial values. The standard deviation is a measure of how much variability there is in a set of numbers. If the numbers are normally distributed (i.e., the distribution is not heavily weighted to one side or another and/or does not have significant outliers), about 68 per cent will fall within one standard deviation above or below the average. Any province scoring one standard deviation above the average is “above average.” Provinces scoring less than the average minus one standard deviation are “below average.” The remaining provinces are “average” performers.